Fig. 6.
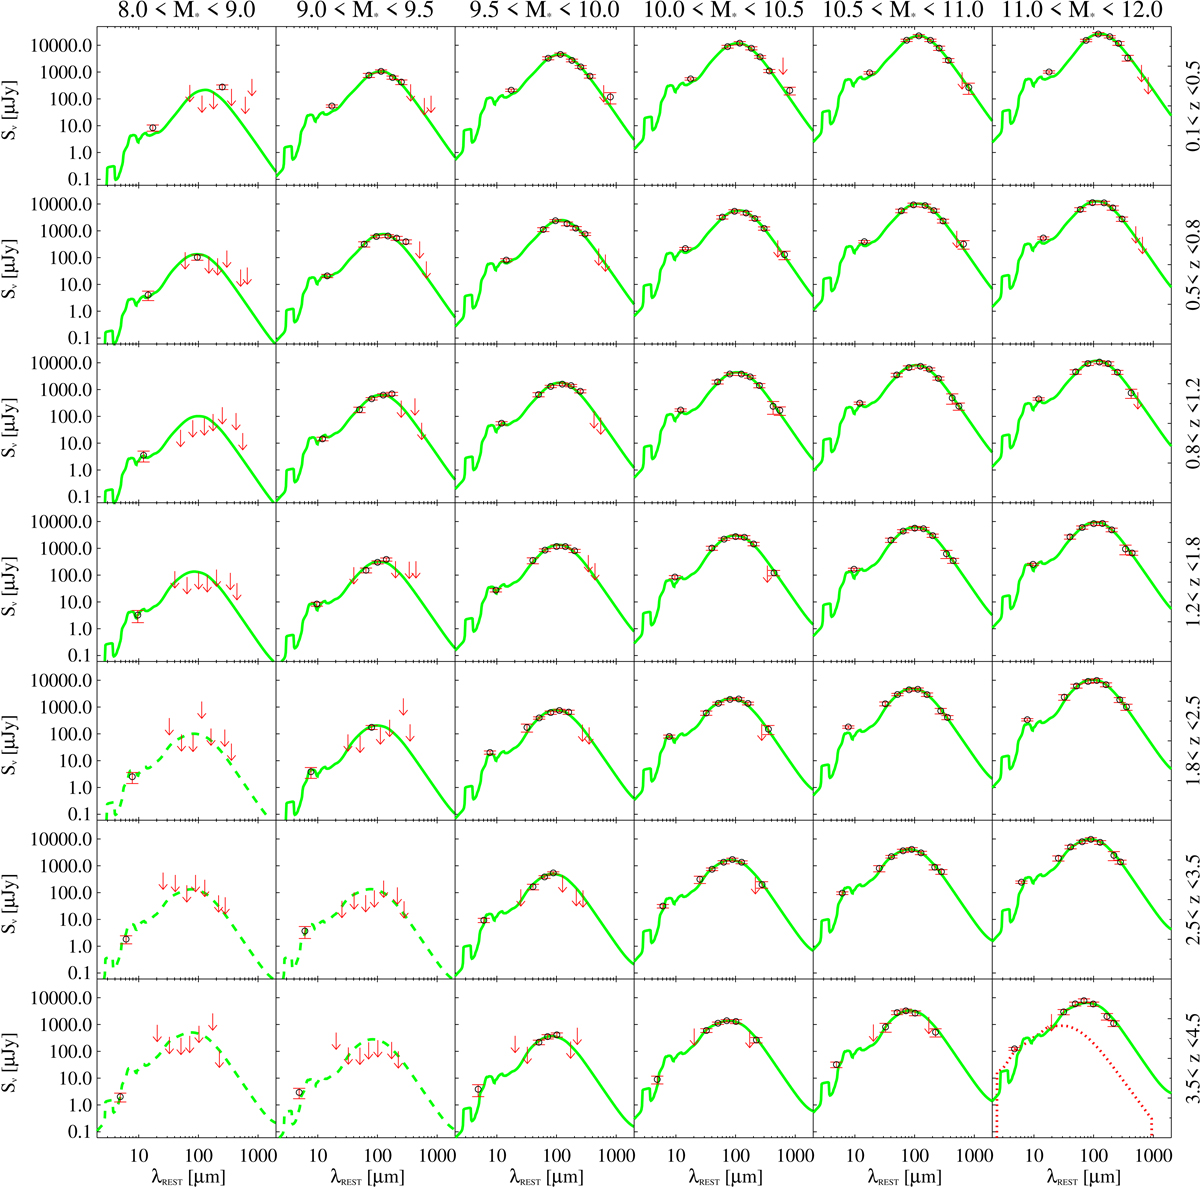
Best-fit template obtained from a SED-fitting decomposition (green lines), as a function of M⋆ (left to right, expressed in log M⊙) and redshift (top to bottom). Red circles indicate the IR/sub-mm photometry (MIPS 24 μm, PACS 100−160 μm, SPIRE 250−350−500 μm, SCUBA 850 μm, and AzTEC 1.1 mm), while downward arrows mark the corresponding 3σ upper limits. The red dotted line is the best-fit AGN template, shown in the only bin where its significance is above 3σ. Green dashed lines represent SEDs without FIR measurements and at z ≳ 1.5, for which the integrated LIR is interpreted as 3σ upper limit (5/42 bins). MIPS 24 μm flux densities are not used in the fitting.
Current usage metrics show cumulative count of Article Views (full-text article views including HTML views, PDF and ePub downloads, according to the available data) and Abstracts Views on Vision4Press platform.
Data correspond to usage on the plateform after 2015. The current usage metrics is available 48-96 hours after online publication and is updated daily on week days.
Initial download of the metrics may take a while.