Fig. 4.
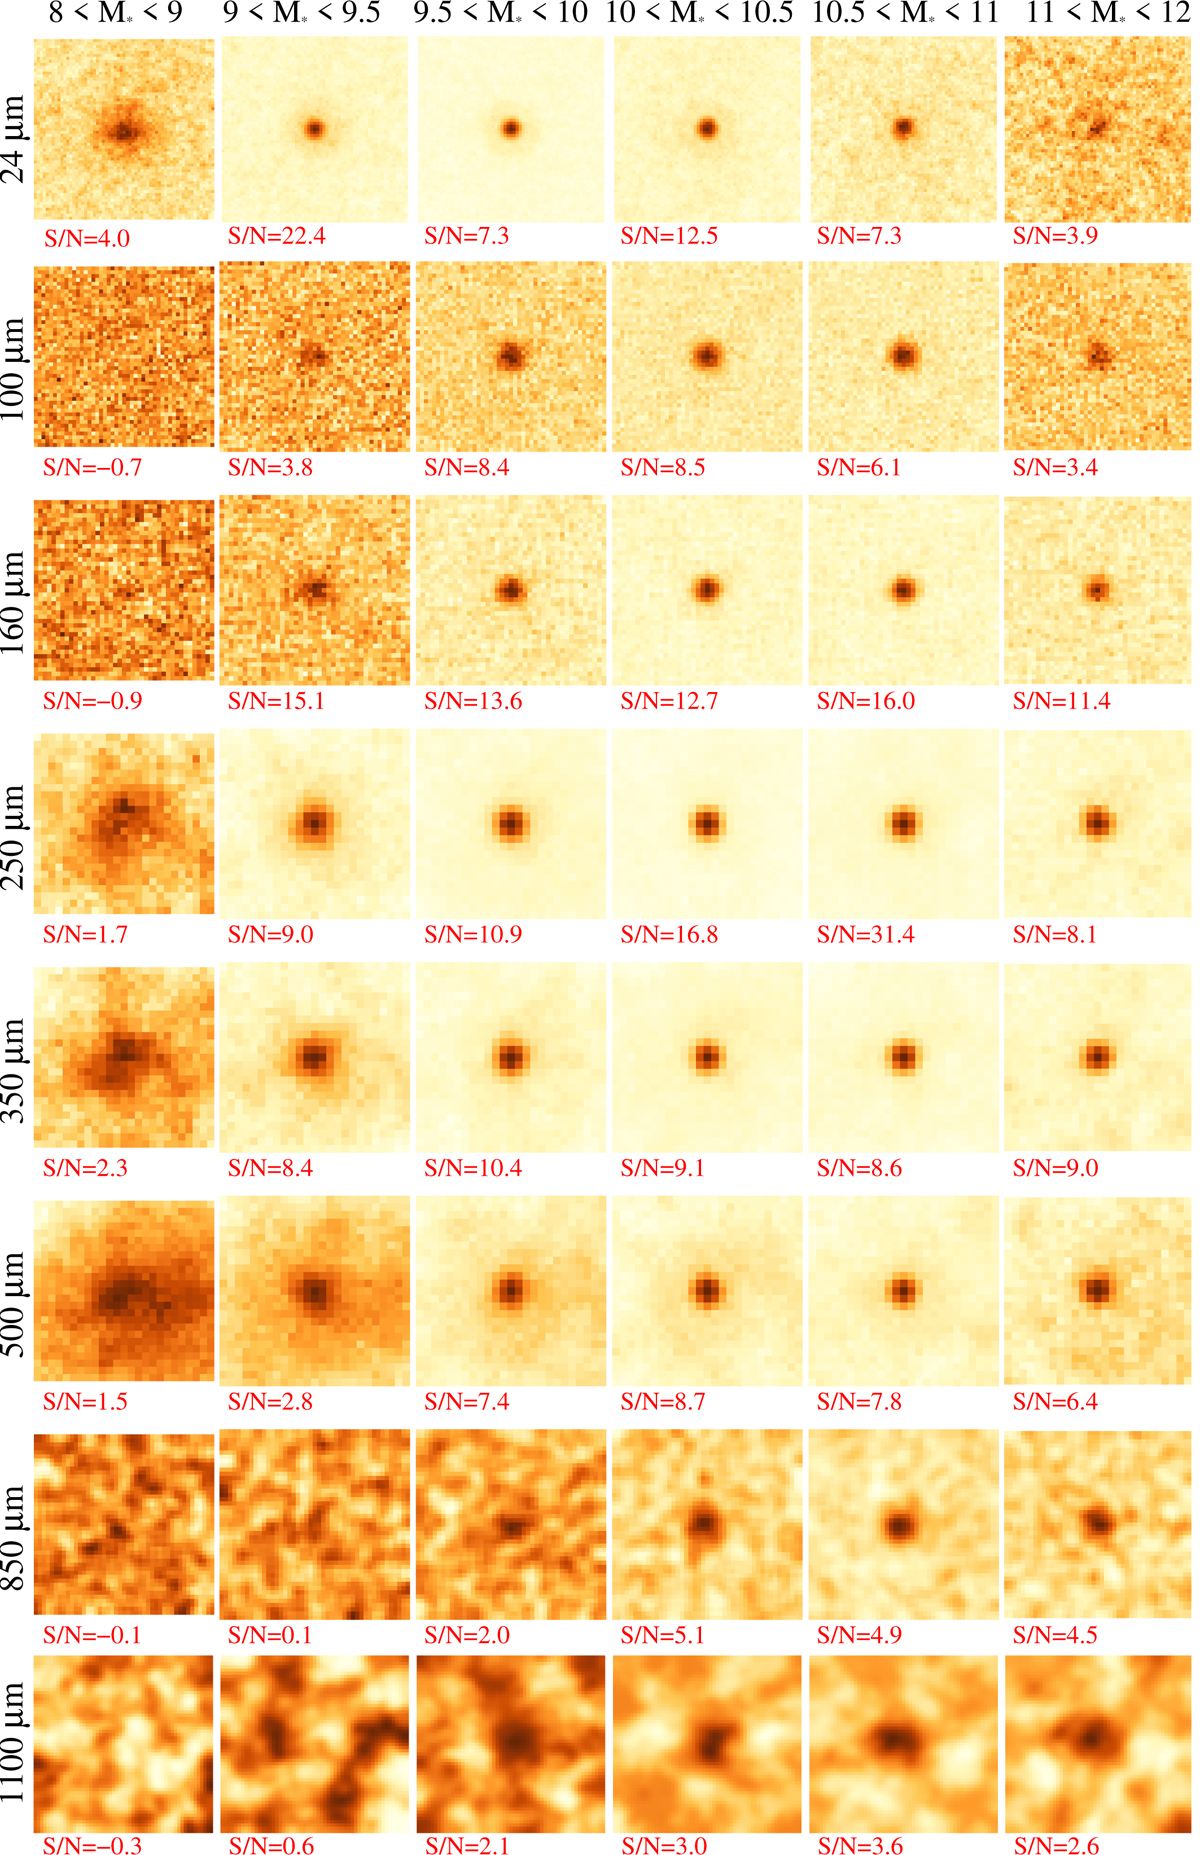
Stacked cutouts of NUVrJ–based SFGs at 0.8 < z < 1.2, as a function of M⋆ (left to right, expressed in log M⊙). Within each bin, we stacked only those sources with S/N < 3 at a given band. SCUBA 850 μm and AzTEC 1100 μm images are smoothed with a Gaussian kernel to ease the visualisation. Each cutout size is 8 × FWHM of the PSF, while for Spitzer-MIPS, we chose 13 × FWHM. Below each cutout, we report the corresponding S/N.
Current usage metrics show cumulative count of Article Views (full-text article views including HTML views, PDF and ePub downloads, according to the available data) and Abstracts Views on Vision4Press platform.
Data correspond to usage on the plateform after 2015. The current usage metrics is available 48-96 hours after online publication and is updated daily on week days.
Initial download of the metrics may take a while.