Fig. D.2.
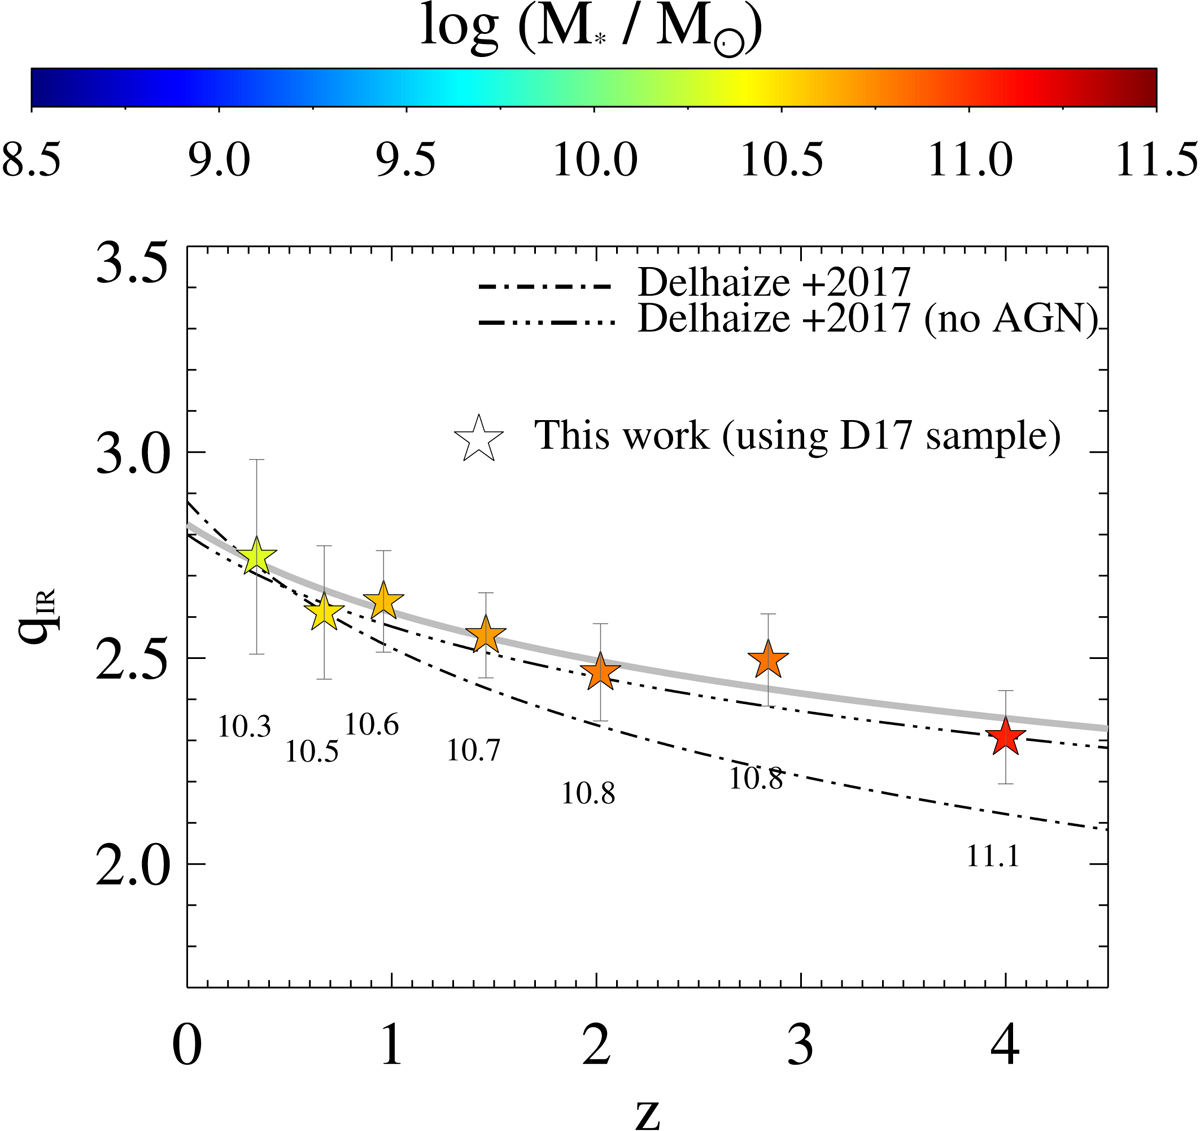
Median qIR as a function of redshift obtained by analysing the SFG sample of Delhaize et al. (2017, stars). Black lines indicate the median qIR − z trend of Delhaize et al. (2017) before (dot-dashed) and after (triple dot-dashed) removing 2σ outliers. The grey solid line marks the resulting best-fit qIR trend with redshift, that is highly consistent with that of Delhaize et al. (2017) after removing radio AGN. Numbers below each star denote the median M⋆ of the underlying sample.
Current usage metrics show cumulative count of Article Views (full-text article views including HTML views, PDF and ePub downloads, according to the available data) and Abstracts Views on Vision4Press platform.
Data correspond to usage on the plateform after 2015. The current usage metrics is available 48-96 hours after online publication and is updated daily on week days.
Initial download of the metrics may take a while.