Fig. B.2.
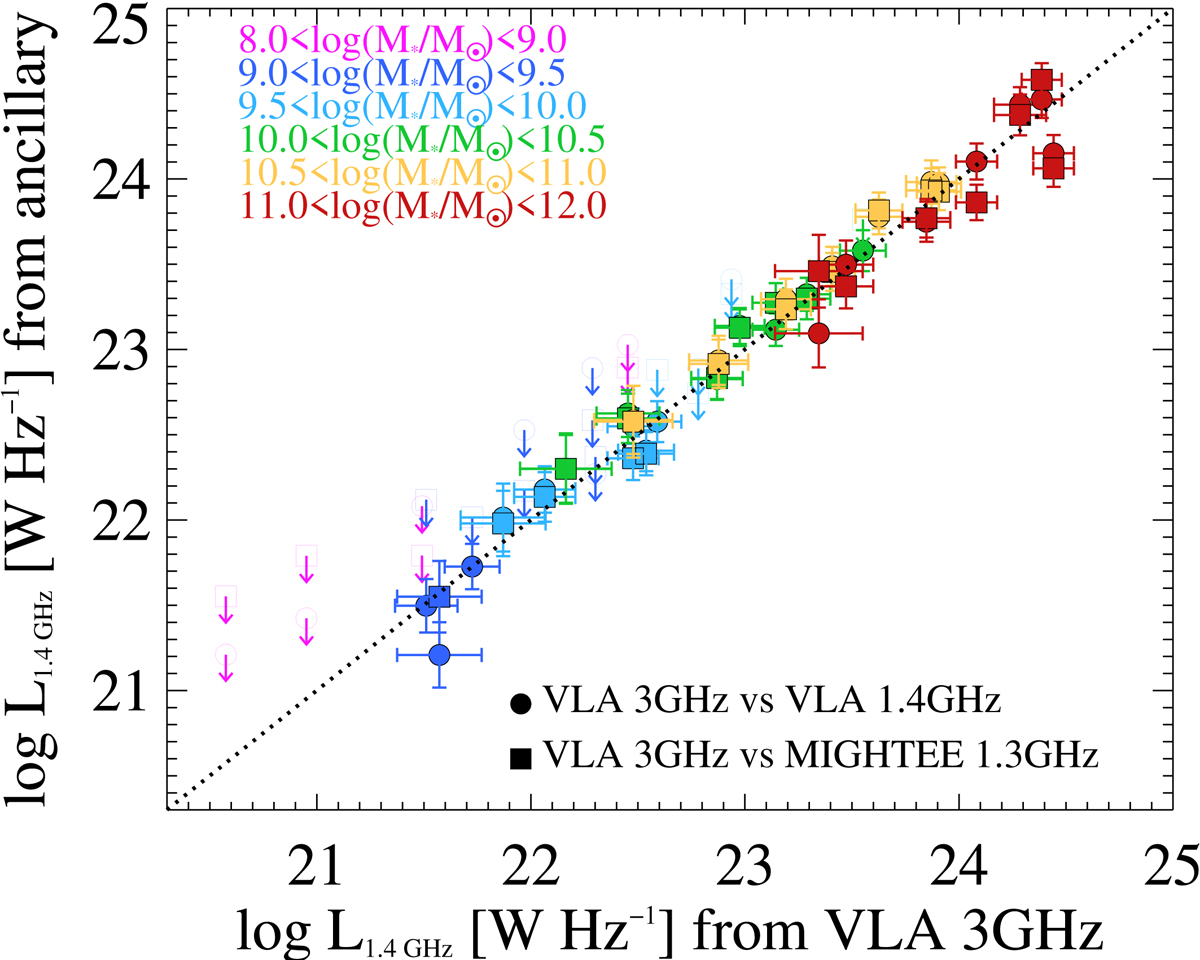
Comparison between rest-frame 1.4 GHz spectral luminosity L1.4 GHz obtained from 3 GHz stacks (x-axis) and ancillary radio stacks (y-axis) using VLA (1.4 GHz, circles) and MIGHTEE (1.3 GHz, squares) data. We assumed a single spectral index α = −0.75 to scale flux densities from 3 GHz to 1.4 GHz. Colours indicate different M⋆ ranges. Downward arrows with open symbols mark 3σ upper limits if S/N < 3. The broad agreement between the various datasets suggests that using a single α = −0.75 is a reasonable assumption across the full M⋆ range explored in this work.
Current usage metrics show cumulative count of Article Views (full-text article views including HTML views, PDF and ePub downloads, according to the available data) and Abstracts Views on Vision4Press platform.
Data correspond to usage on the plateform after 2015. The current usage metrics is available 48-96 hours after online publication and is updated daily on week days.
Initial download of the metrics may take a while.