Fig. B.1.
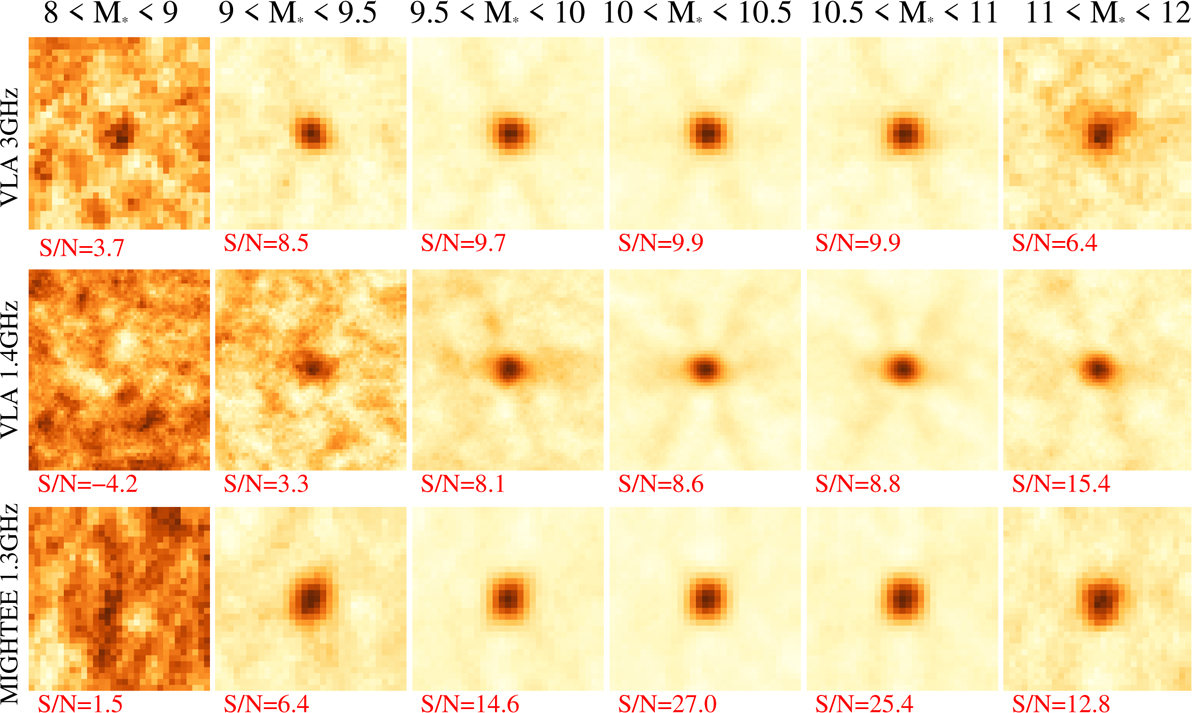
Stacked cutouts of our sample at 0.8 < z < 1.2, as a function of M⋆ (left to right, expressed in log M⊙). Only individual undetected sources (S/N < 3) are stacked. Top, middle and bottom rows: VLA 3 GHz, VLA 1.4 GHz and MIGHTEE 1.3 GHz data, respectively. Each cutout size corresponds to 8 × FWHM of the beam. Below each cutout we report the corresponding S/N of the total stacked flux.
Current usage metrics show cumulative count of Article Views (full-text article views including HTML views, PDF and ePub downloads, according to the available data) and Abstracts Views on Vision4Press platform.
Data correspond to usage on the plateform after 2015. The current usage metrics is available 48-96 hours after online publication and is updated daily on week days.
Initial download of the metrics may take a while.