Fig. 2.
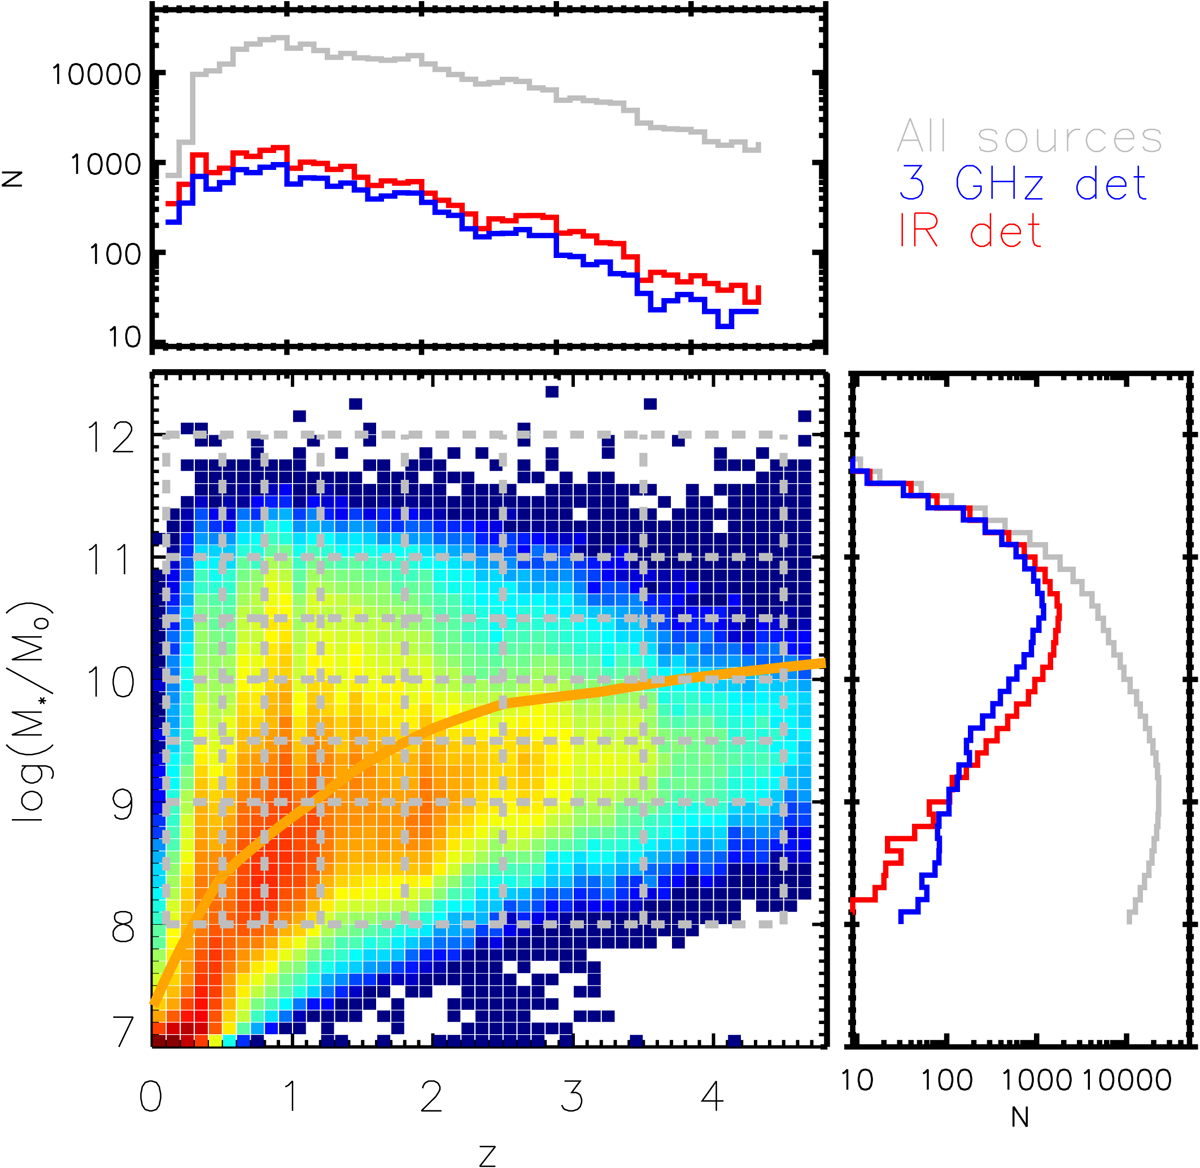
Distribution of NUVrJ star-forming galaxies as a function of M⋆ and redshift. The colour scale in the central panel indicates the underlying sample size, increasing from blue to red. The grey-dashed grid encloses the 42 M⋆ − z bins into which we split our sample (413 678 objects). Galaxies within that grid are projected on the upper-left and bottom right histograms with redshift and M⋆, respectively (grey lines). The blue and red histograms represent the subsample with a signal-to-noise ratio (S/N) that is greater than 3 at 3 GHz and across all IR bands, respectively (see Sects. 2.2 and 2.3). The orange solid line marks the 90% M⋆ completeness limit of Laigle et al. (2016) for comparison.
Current usage metrics show cumulative count of Article Views (full-text article views including HTML views, PDF and ePub downloads, according to the available data) and Abstracts Views on Vision4Press platform.
Data correspond to usage on the plateform after 2015. The current usage metrics is available 48-96 hours after online publication and is updated daily on week days.
Initial download of the metrics may take a while.