Open Access
Fig. A.2.
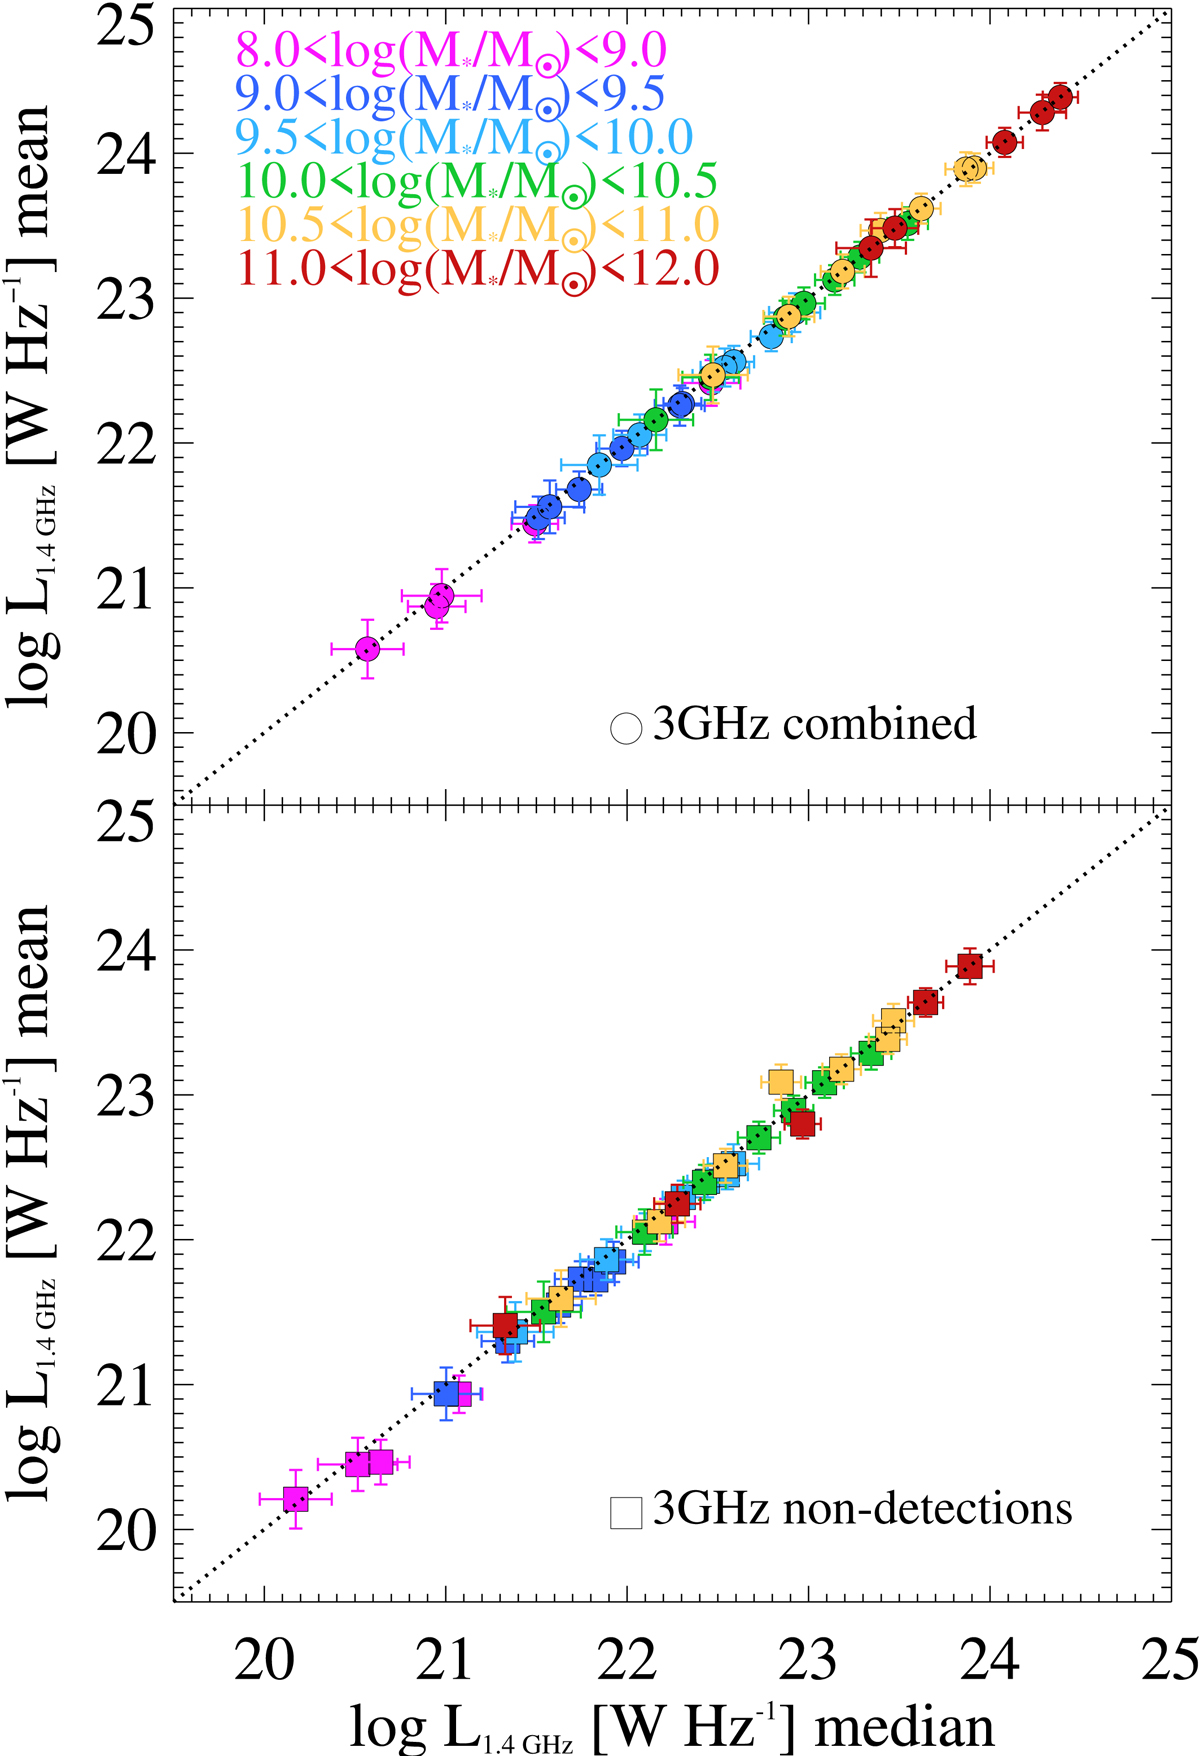
Top panel: comparison between median L1.4 GHz (x-axis) and rms-weighted mean L1.4 GHz (y-axis) for combined 3 GHz detections and non-detections, following Eq. (3). Colours indicate various M⋆ bins. Bottom panel: same comparison, but referring to 3 GHz undetected sources only.
Current usage metrics show cumulative count of Article Views (full-text article views including HTML views, PDF and ePub downloads, according to the available data) and Abstracts Views on Vision4Press platform.
Data correspond to usage on the plateform after 2015. The current usage metrics is available 48-96 hours after online publication and is updated daily on week days.
Initial download of the metrics may take a while.