Fig. A.1.
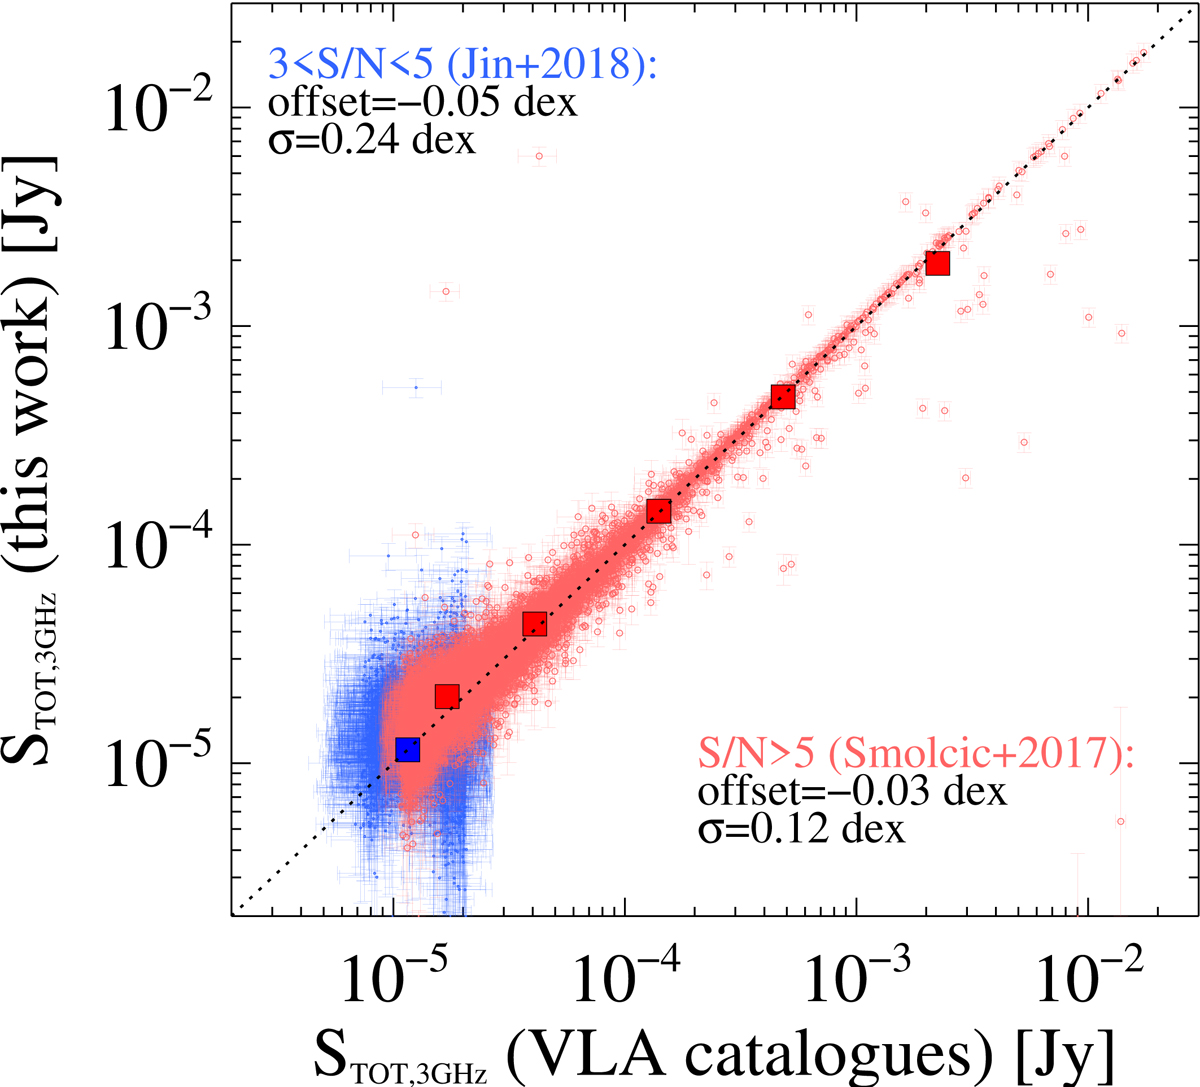
Comparison of total flux densities of 3 GHz detections between our procedure and catalogue flux densities, both at S/N > 5 (Smolčić et al. 2017a, red dots) and at 3 < S/N < 5 (Jin et al. 2018, blue dots). Squares highlight the median ratio at various intervals. The global offset and dispersion suggest a good agreement within the uncertainties down to S/N ∼ 3.
Current usage metrics show cumulative count of Article Views (full-text article views including HTML views, PDF and ePub downloads, according to the available data) and Abstracts Views on Vision4Press platform.
Data correspond to usage on the plateform after 2015. The current usage metrics is available 48-96 hours after online publication and is updated daily on week days.
Initial download of the metrics may take a while.