Fig. 16.
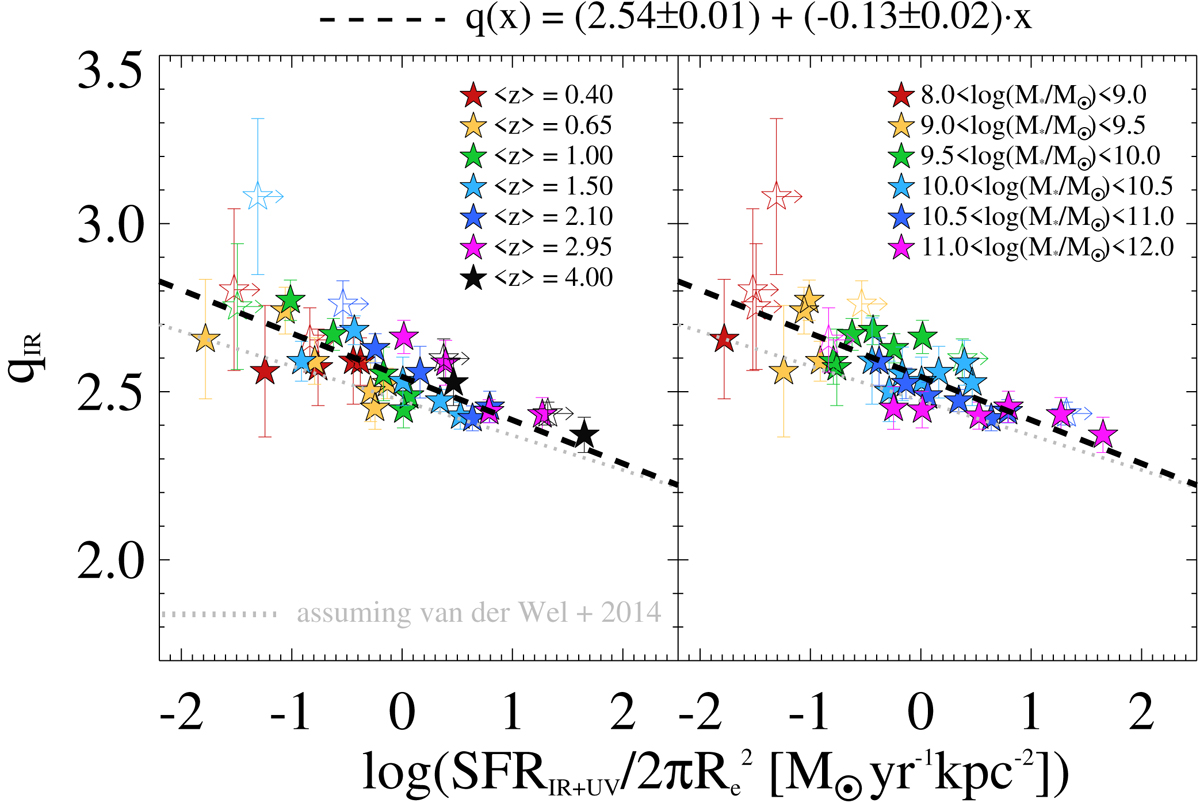
Evolution of qIR as a function of SFR surface density (ΣSFR = SFRIR + UV/2![]() ), colour coded by redshift (left panel) and by M⋆ (right panel). The SFRIR + UV estimates are taken from Sect. 3.3, while the effective radius Re is measured from stacked 3 GHz images via 2D Gaussian fitting. This plot shows a significant anti-correlation similar in slope to that observed with M⋆ (Sect. 4.3), marked by the black dashed line (qIR ∝ ( − 0.13 ± 0.02) × logΣSFR). For comparison, the best-fit trend with rest-frame optical (5000 Å) sizes estimated from van der Wel et al. (2014) scaling relation is shown (grey dotted line).
), colour coded by redshift (left panel) and by M⋆ (right panel). The SFRIR + UV estimates are taken from Sect. 3.3, while the effective radius Re is measured from stacked 3 GHz images via 2D Gaussian fitting. This plot shows a significant anti-correlation similar in slope to that observed with M⋆ (Sect. 4.3), marked by the black dashed line (qIR ∝ ( − 0.13 ± 0.02) × logΣSFR). For comparison, the best-fit trend with rest-frame optical (5000 Å) sizes estimated from van der Wel et al. (2014) scaling relation is shown (grey dotted line).
Current usage metrics show cumulative count of Article Views (full-text article views including HTML views, PDF and ePub downloads, according to the available data) and Abstracts Views on Vision4Press platform.
Data correspond to usage on the plateform after 2015. The current usage metrics is available 48-96 hours after online publication and is updated daily on week days.
Initial download of the metrics may take a while.