Fig. 15.
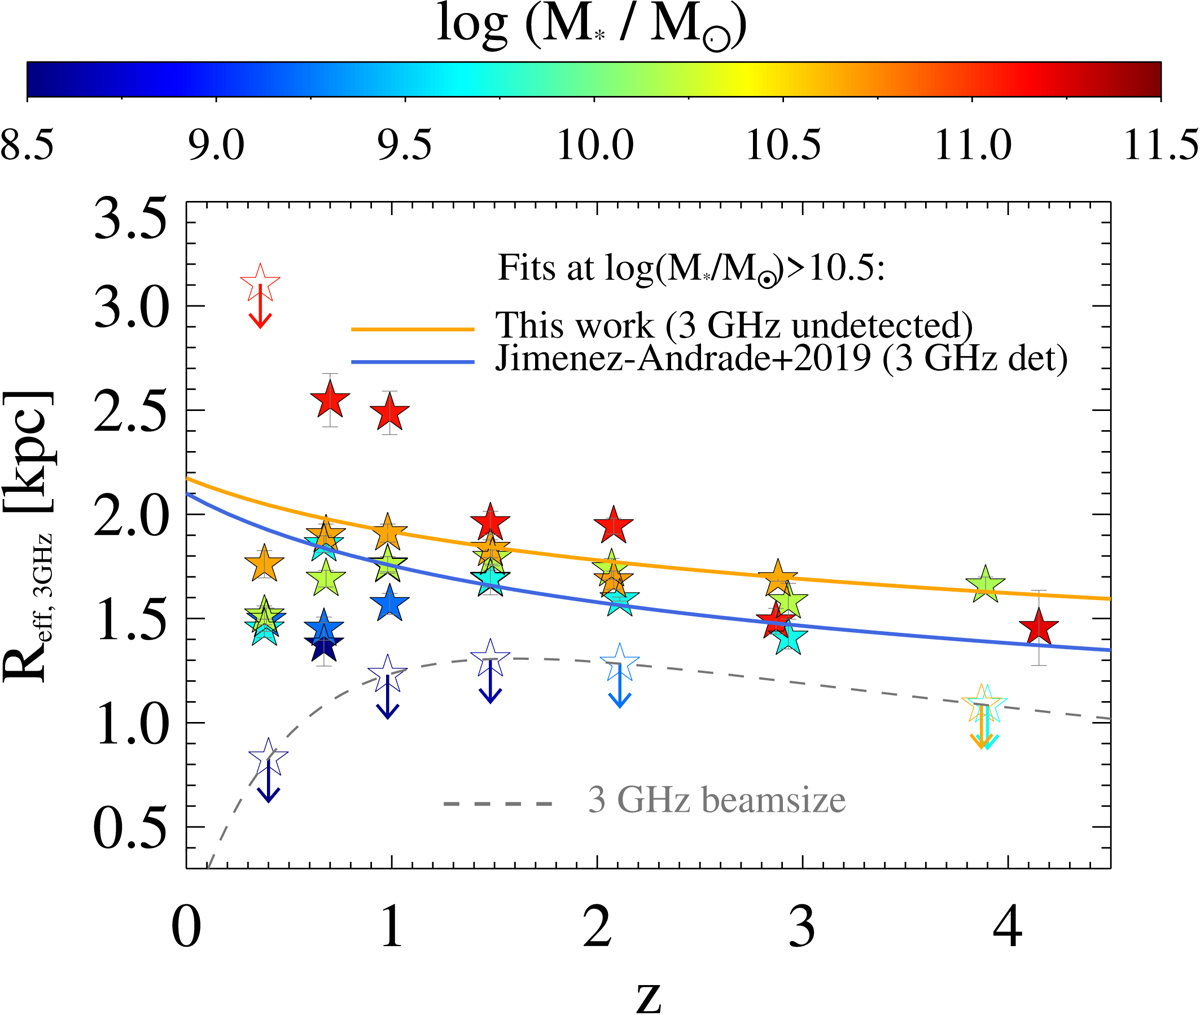
Distribution of 3 GHz effective radius (in kpc) as a function of redshift and colour-coded by M⋆ (stars). Size measurements are taken from median stacked 3 GHz images of non-detections. Upper limits are given for unresolved stacks and correspond to the angular 3 GHz beam size (0.75″, grey dashed line). We observe a clear increase of Re with galaxy M⋆. The bins at M⋆ > 1010.5 M⊙ with resolved emission are fitted with a power-law redshift trend, which yields Re ∝ (1 + z)−0.18 ± 0.07 (orange solid line). A comparison study by Jiménez-Andrade et al. (2019) is shown (blue solid line) for 3 GHz detected SFGs at similar M⋆ in COSMOS, obtaining Re ∝ (1 + z)−0.26 ± 0.08.
Current usage metrics show cumulative count of Article Views (full-text article views including HTML views, PDF and ePub downloads, according to the available data) and Abstracts Views on Vision4Press platform.
Data correspond to usage on the plateform after 2015. The current usage metrics is available 48-96 hours after online publication and is updated daily on week days.
Initial download of the metrics may take a while.