Fig. 14.
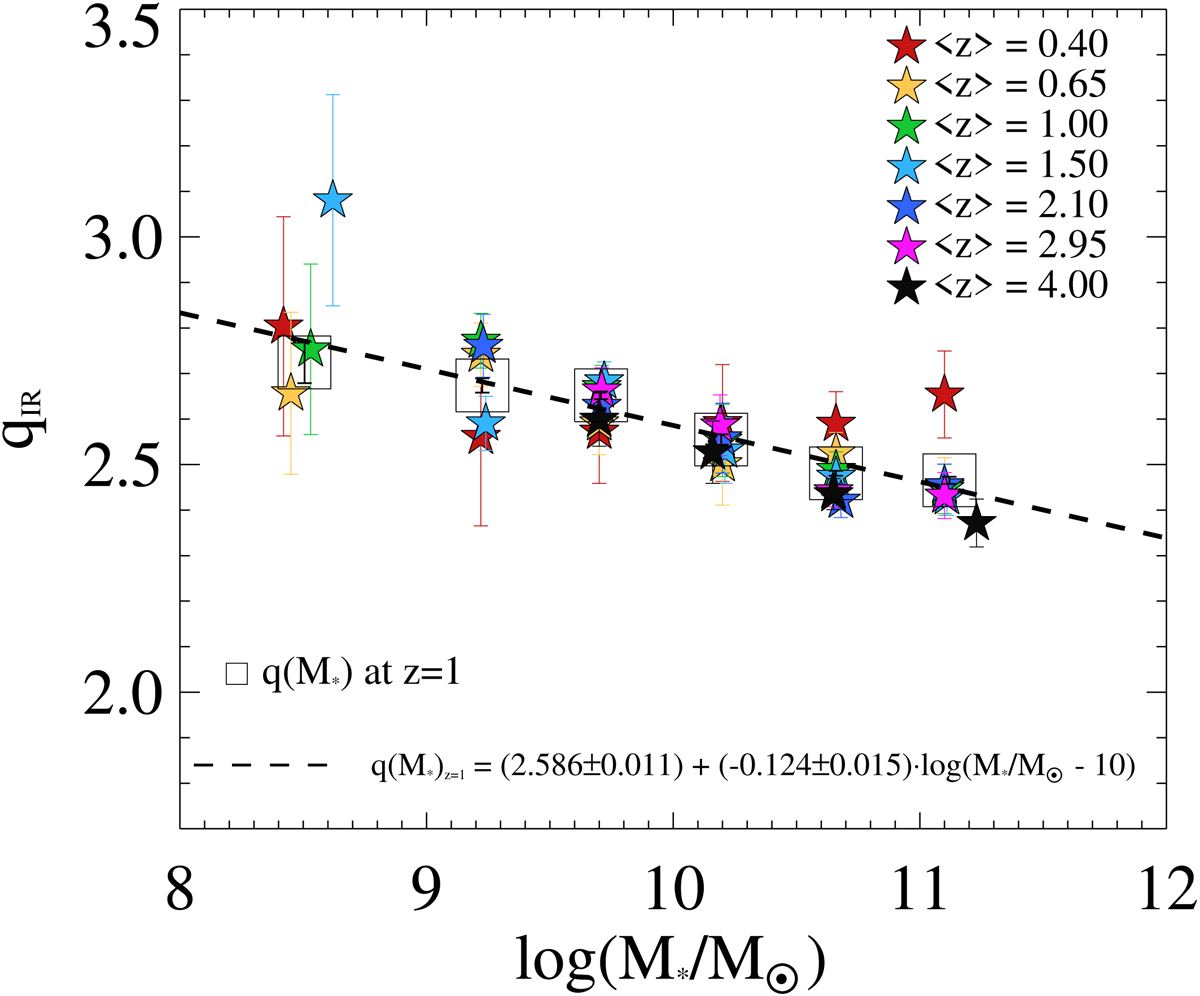
Distribution of AGN-corrected qIR as a function M⋆, colour-coded by redshift (stars). At each M⋆, open squares indicate the median qIR values at z = 1, obtained after propagating the uncertainties of slope and normalisation of the corresponding qIR − z fit and interpolating each at z = 1. These values were fitted with a linear function in log − log space (black dashed line).
Current usage metrics show cumulative count of Article Views (full-text article views including HTML views, PDF and ePub downloads, according to the available data) and Abstracts Views on Vision4Press platform.
Data correspond to usage on the plateform after 2015. The current usage metrics is available 48-96 hours after online publication and is updated daily on week days.
Initial download of the metrics may take a while.