Fig. 13.
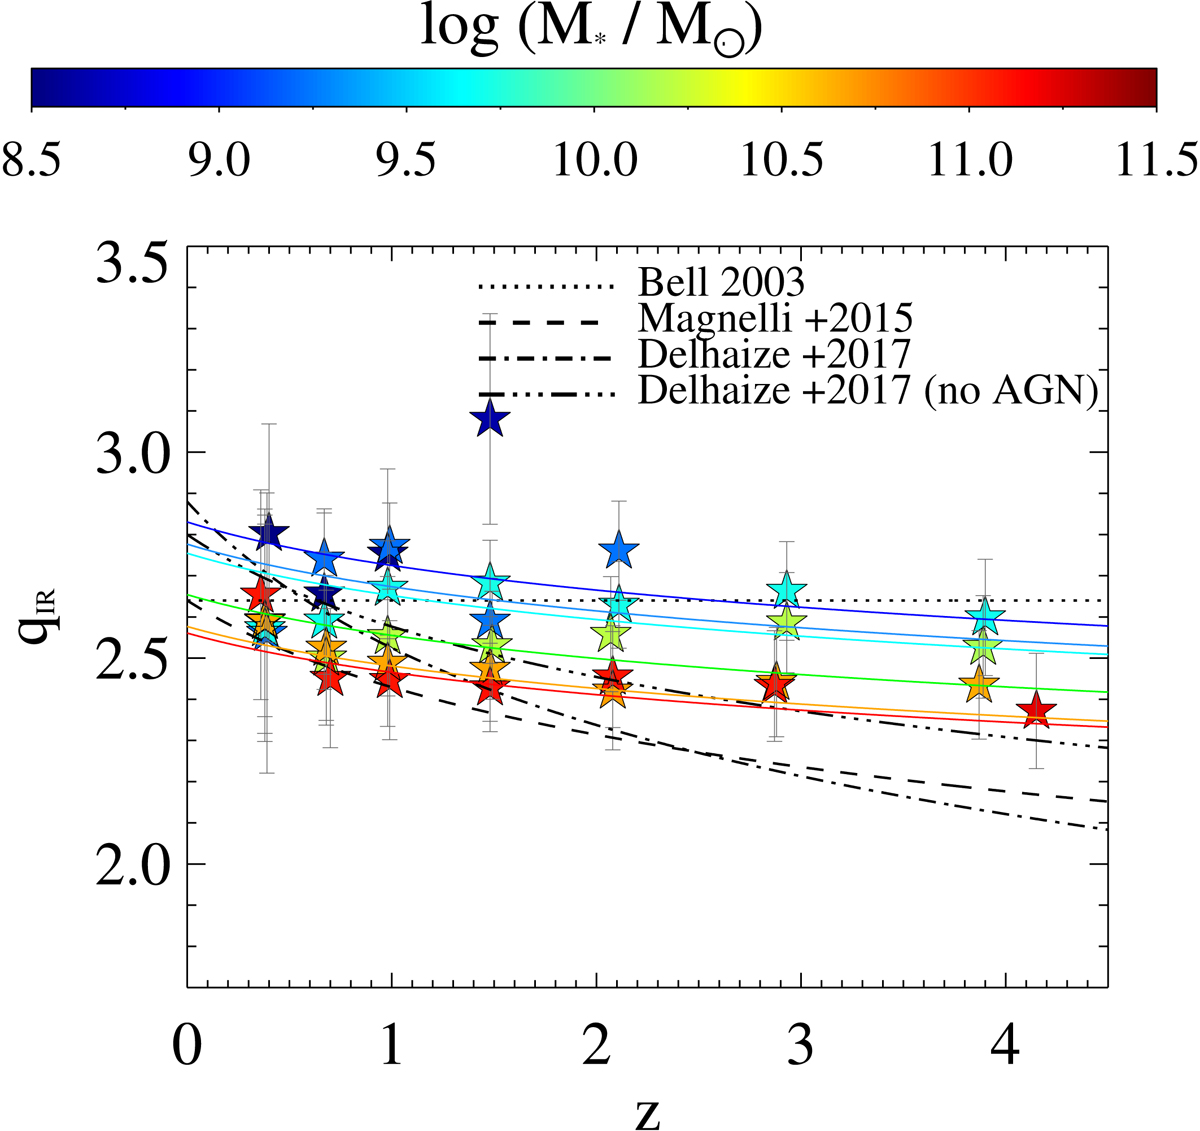
Intrinsic (i.e. AGN-corrected) qIR evolution as a function of redshift (x-axis) and M⋆ (colour bar). The LIR estimates are the same reported in Fig. 8, while L1.4 GHz measurements have been re-calculated after excluding radio-detected AGN (Sect. 4.2). For comparison, other IRRC trends with redshift are taken from the literature (black lines): Bell (2003, dotted); Magnelli et al. (2015, dashed); Delhaize et al. (2017, dot-dashed) and their AGN-corrected version after removing 2σ outliers (triple dot-dashed lines).
Current usage metrics show cumulative count of Article Views (full-text article views including HTML views, PDF and ePub downloads, according to the available data) and Abstracts Views on Vision4Press platform.
Data correspond to usage on the plateform after 2015. The current usage metrics is available 48-96 hours after online publication and is updated daily on week days.
Initial download of the metrics may take a while.