Fig. 12.
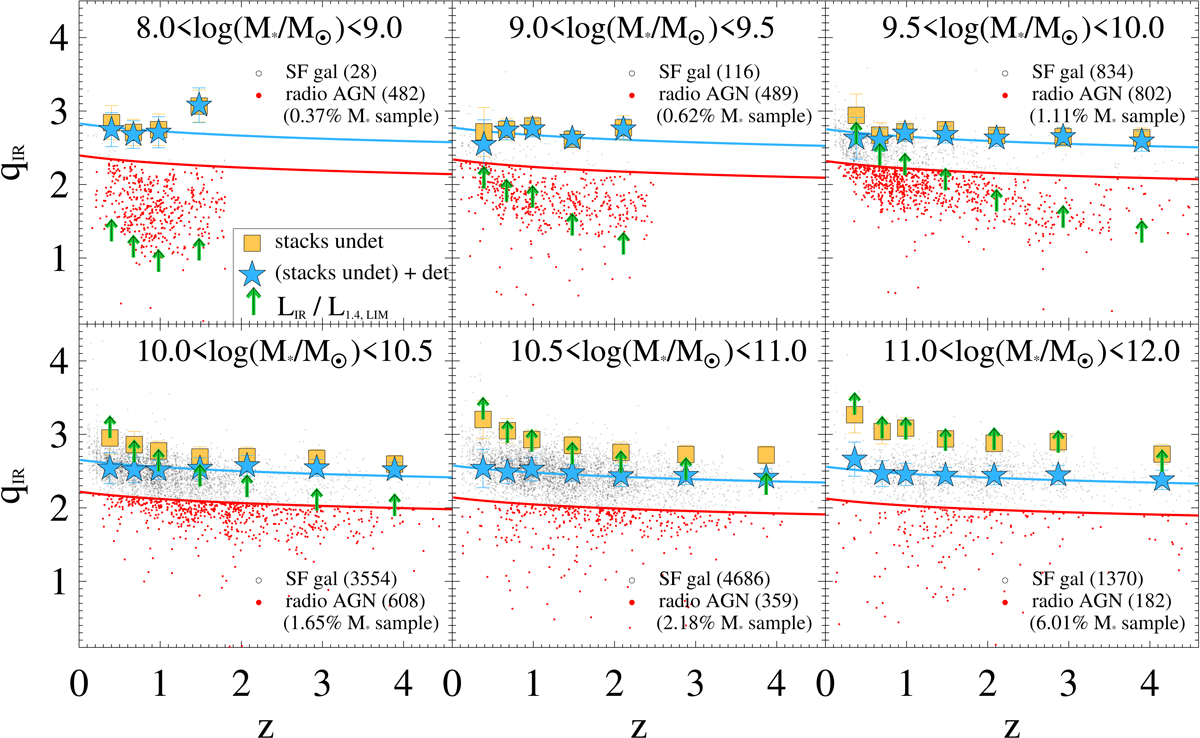
Distribution of qIR as a function of redshift and M⋆, after removing radio AGN (red dots). Symbols are the same as in Fig. 9, except for the median qIR estimates (blue stars), which are here re-calculated after removing radio-excess AGN (red dots). Fractions of radio-detected AGN and SFGs are reported in each M⋆-bin, as well as the fraction of AGN relative to the full M⋆ sample analysed in this work (in brackets). The blue and red solid lines denote the intrinsic IRRC of SFGs and the locus below which we classify radio sources as AGN (0.43 dex below the IRRC), respectively.
Current usage metrics show cumulative count of Article Views (full-text article views including HTML views, PDF and ePub downloads, according to the available data) and Abstracts Views on Vision4Press platform.
Data correspond to usage on the plateform after 2015. The current usage metrics is available 48-96 hours after online publication and is updated daily on week days.
Initial download of the metrics may take a while.