Fig. 10.
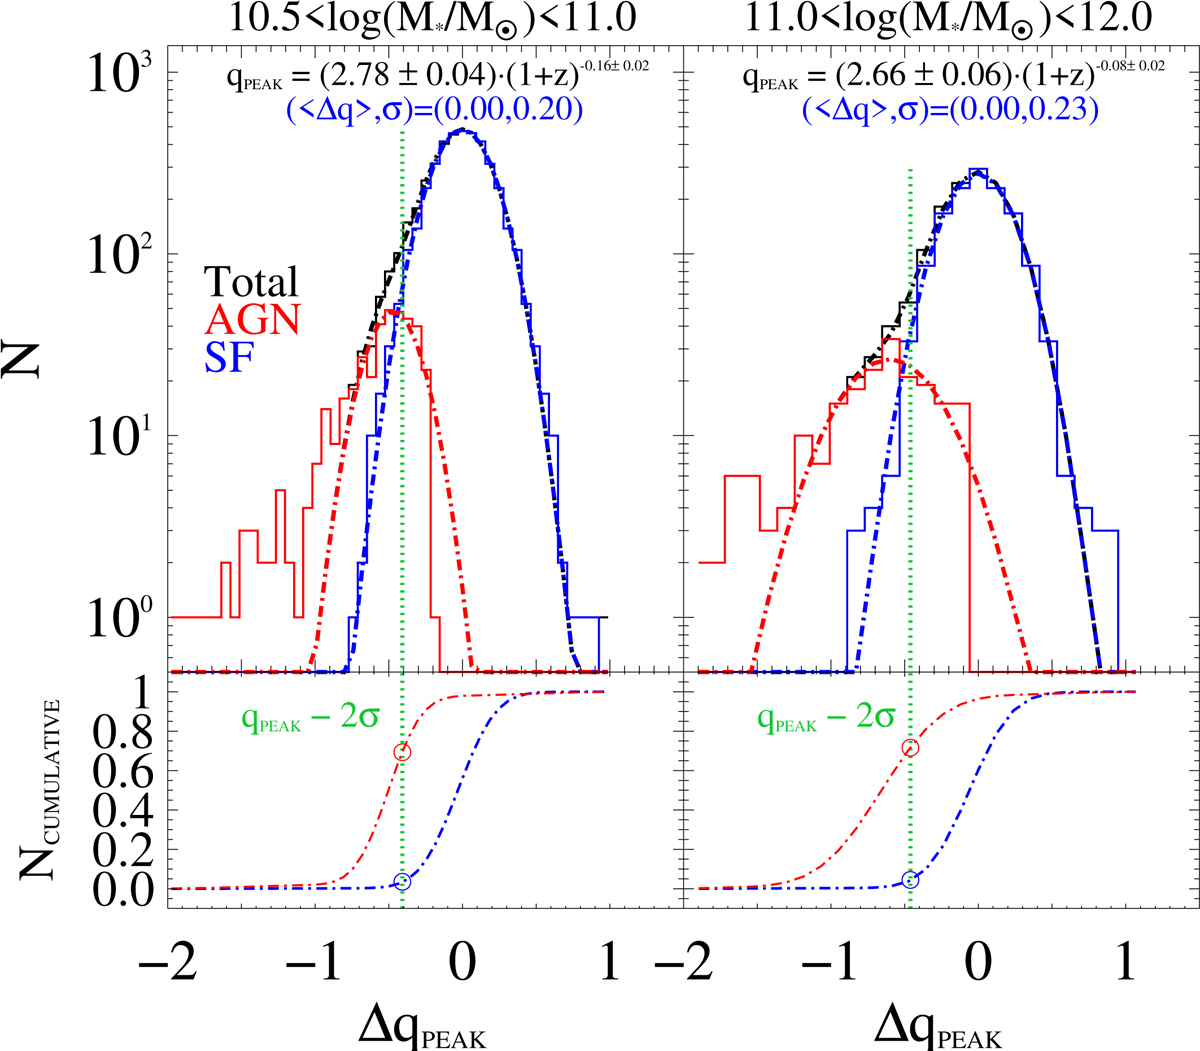
qIR distribution of 3 GHz detections in the two highest M⋆ bins (left and right panels), after correcting for the internal qIR–redshift dependence. Only sources within complete z-bins were considered at each M⋆. The total distribution (black histogram) was dissected among SF-dominated (blue) and AGN-dominated (red) radio sources, and fitted with two separate Gaussian functions (dot-dashed lines). While the SF population was fitted first, the AGN part was fitted in a second step from the total–SF residuals. The 1σ dispersion attributed to SF equals 0.20 and 0.23 dex at 1010.5 < M⋆/M⊙ < 1011 and 1011 < M⋆/M⊙ < 1012, respectively. Bottom panels: corresponding cumulative Gaussian fits, both normalised to unity. The vertical green dotted line marks the threshold that best separates between the SF and AGN populations (see Table 3), which rejects about 70% AGN and only 3−4% SFGs (open circles).
Current usage metrics show cumulative count of Article Views (full-text article views including HTML views, PDF and ePub downloads, according to the available data) and Abstracts Views on Vision4Press platform.
Data correspond to usage on the plateform after 2015. The current usage metrics is available 48-96 hours after online publication and is updated daily on week days.
Initial download of the metrics may take a while.