Fig. 5
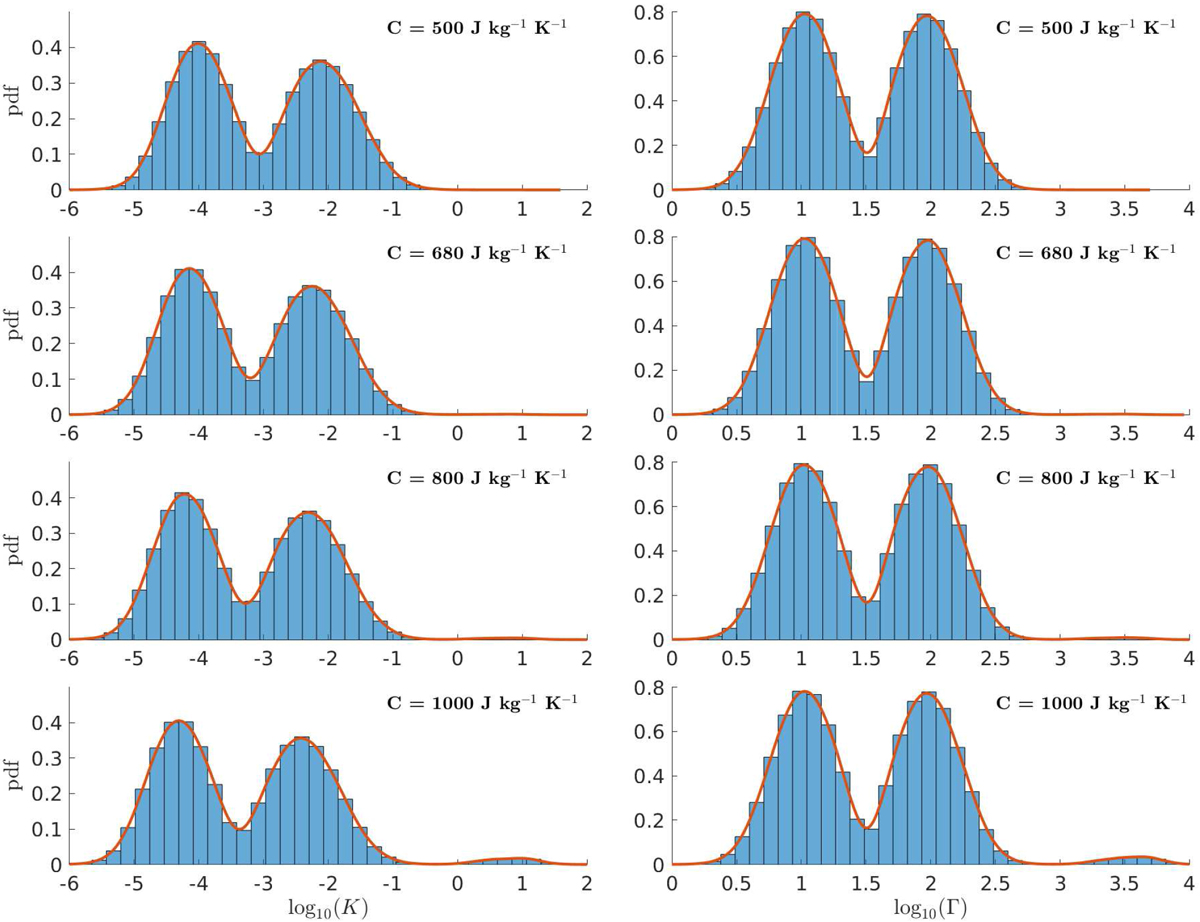
Derived thermal parameters of 2011 PT obtained from the Monte Carlo simulations for different values of the heat capacity C. The plots in the first column show the distribution of the thermal conductivity K, and the plots in the second column show the distribution of the thermal inertia
Γ. The thermal inertia is obtained through ![]() , where ρ
is the corresponding value of the density used to invert Eq. (7).
, where ρ
is the corresponding value of the density used to invert Eq. (7).
Current usage metrics show cumulative count of Article Views (full-text article views including HTML views, PDF and ePub downloads, according to the available data) and Abstracts Views on Vision4Press platform.
Data correspond to usage on the plateform after 2015. The current usage metrics is available 48-96 hours after online publication and is updated daily on week days.
Initial download of the metrics may take a while.