Free Access
Fig. 4
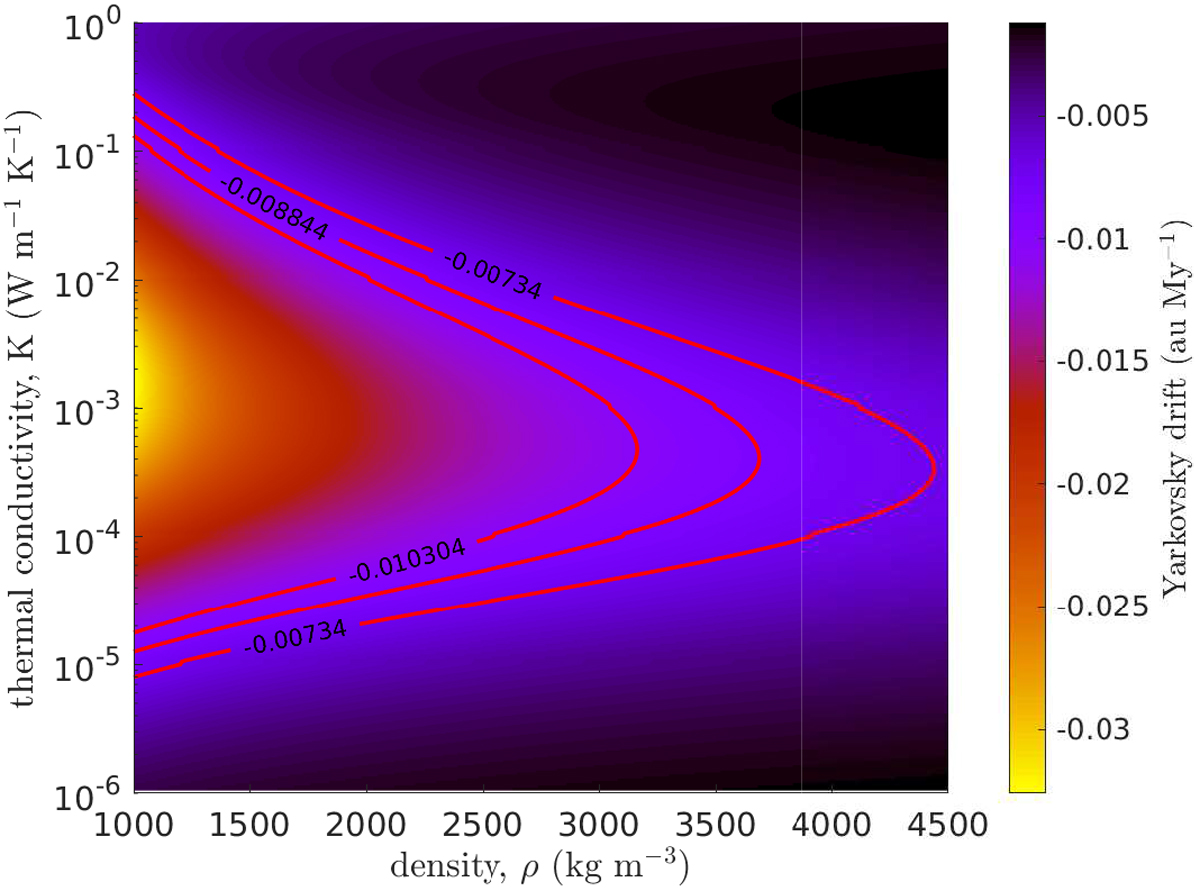
Estimated maximum negative Yarkovsky drift for 2011 PT obtained for C = 680 J kg−1 K−1, D = 35 m, and P = 0.17 h. The red level curves correspond to the nominal Yarkovsky drift (central level curve), and the drift obtained taking the uncertainties into account (external level curves).
Current usage metrics show cumulative count of Article Views (full-text article views including HTML views, PDF and ePub downloads, according to the available data) and Abstracts Views on Vision4Press platform.
Data correspond to usage on the plateform after 2015. The current usage metrics is available 48-96 hours after online publication and is updated daily on week days.
Initial download of the metrics may take a while.