Fig. 5.
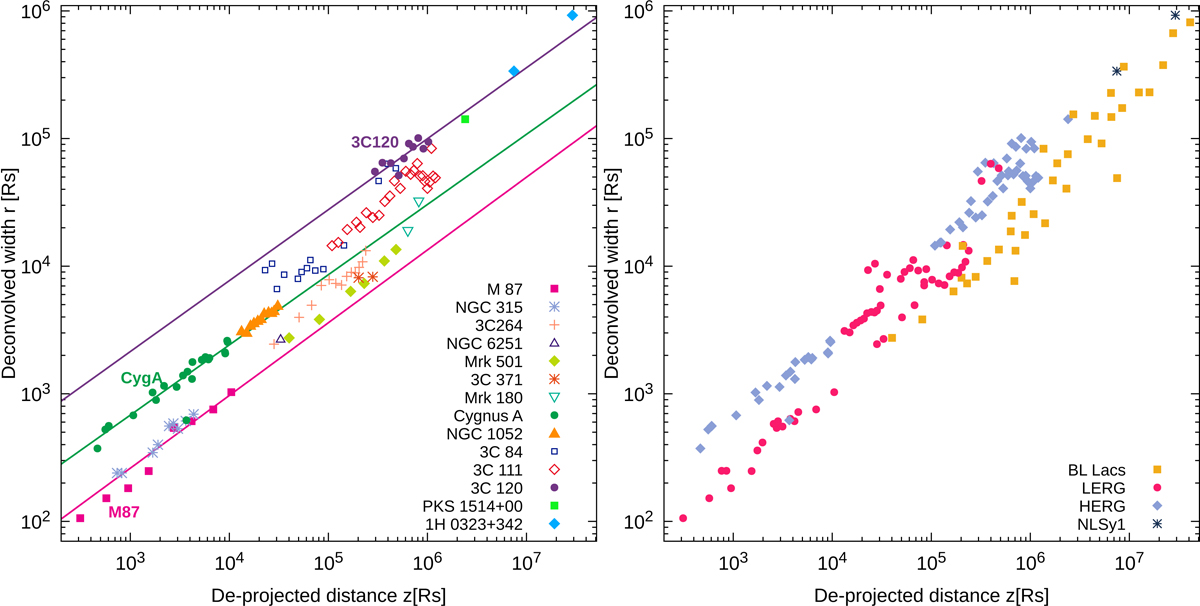
Jet collimation profiles of the sources in Table 5. For jets showing a parabolic expansion at their base, we only report the parabolic region. For NGC 315, we show results from this paper; for Cygnus A, we report 43 GHz data from Boccardi et al. (2016a); for 3C 264, 15 GHz data from Boccardi et al. (2019); for the rest of the sources we use 15 GHz data based on published MOJAVE results (Lister et al. 2019). In the case of M 87, and possibly of Mrk 501, the 15 GHz data describe only part of the parabolic region. Left panel: profile of the parabolically expanding jets in the sample. Each source is labeled using a different color and point type. The solid lines represent fits to the data of M 87, Cygnus A, and 3C 120 (magenta, green, and violet line, respectively). Right panel: profile of all the sources in the sample, divided per classes. Light blue points are assigned to the HERG, magenta points to the LERG, orange points to the BL Lacs, and the dark blue points to the NLSy1.
Current usage metrics show cumulative count of Article Views (full-text article views including HTML views, PDF and ePub downloads, according to the available data) and Abstracts Views on Vision4Press platform.
Data correspond to usage on the plateform after 2015. The current usage metrics is available 48-96 hours after online publication and is updated daily on week days.
Initial download of the metrics may take a while.