Fig. 6
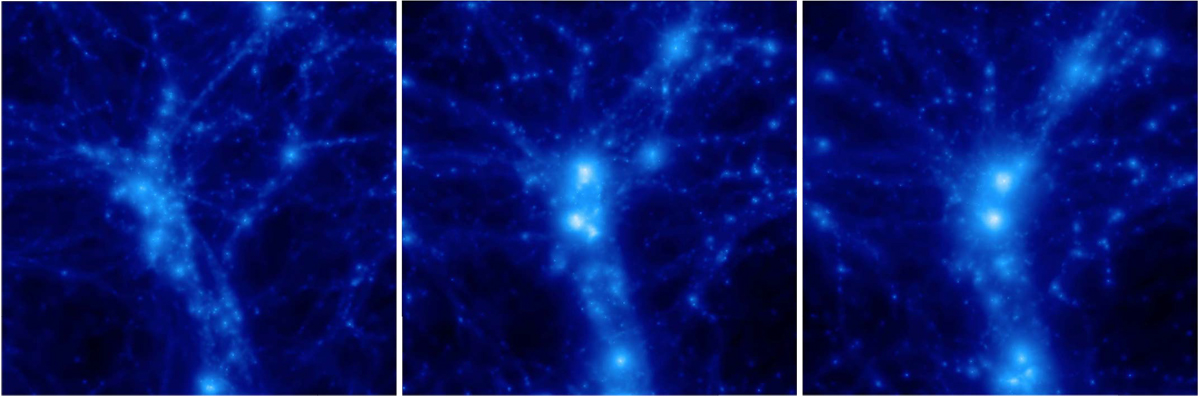
Large-scale evolution of the A3391/95 analog found in the Magneticum simulation. The gas density distribution is shown in a cubic cutout region of 20 Mpc∕h per side around the redshift of the main system in comoving coordinates from redshift z ≈ 1 (left) to z ≈ 0.34 (middle) and z ≈ 0.07 (right). We note the clumps falling in along the large-scale filaments, merging with the main systems to form ever larger, denser, and hotter structures. The corresponding movie with more redshift snapshots is available online.
Current usage metrics show cumulative count of Article Views (full-text article views including HTML views, PDF and ePub downloads, according to the available data) and Abstracts Views on Vision4Press platform.
Data correspond to usage on the plateform after 2015. The current usage metrics is available 48-96 hours after online publication and is updated daily on week days.
Initial download of the metrics may take a while.