Fig. 4
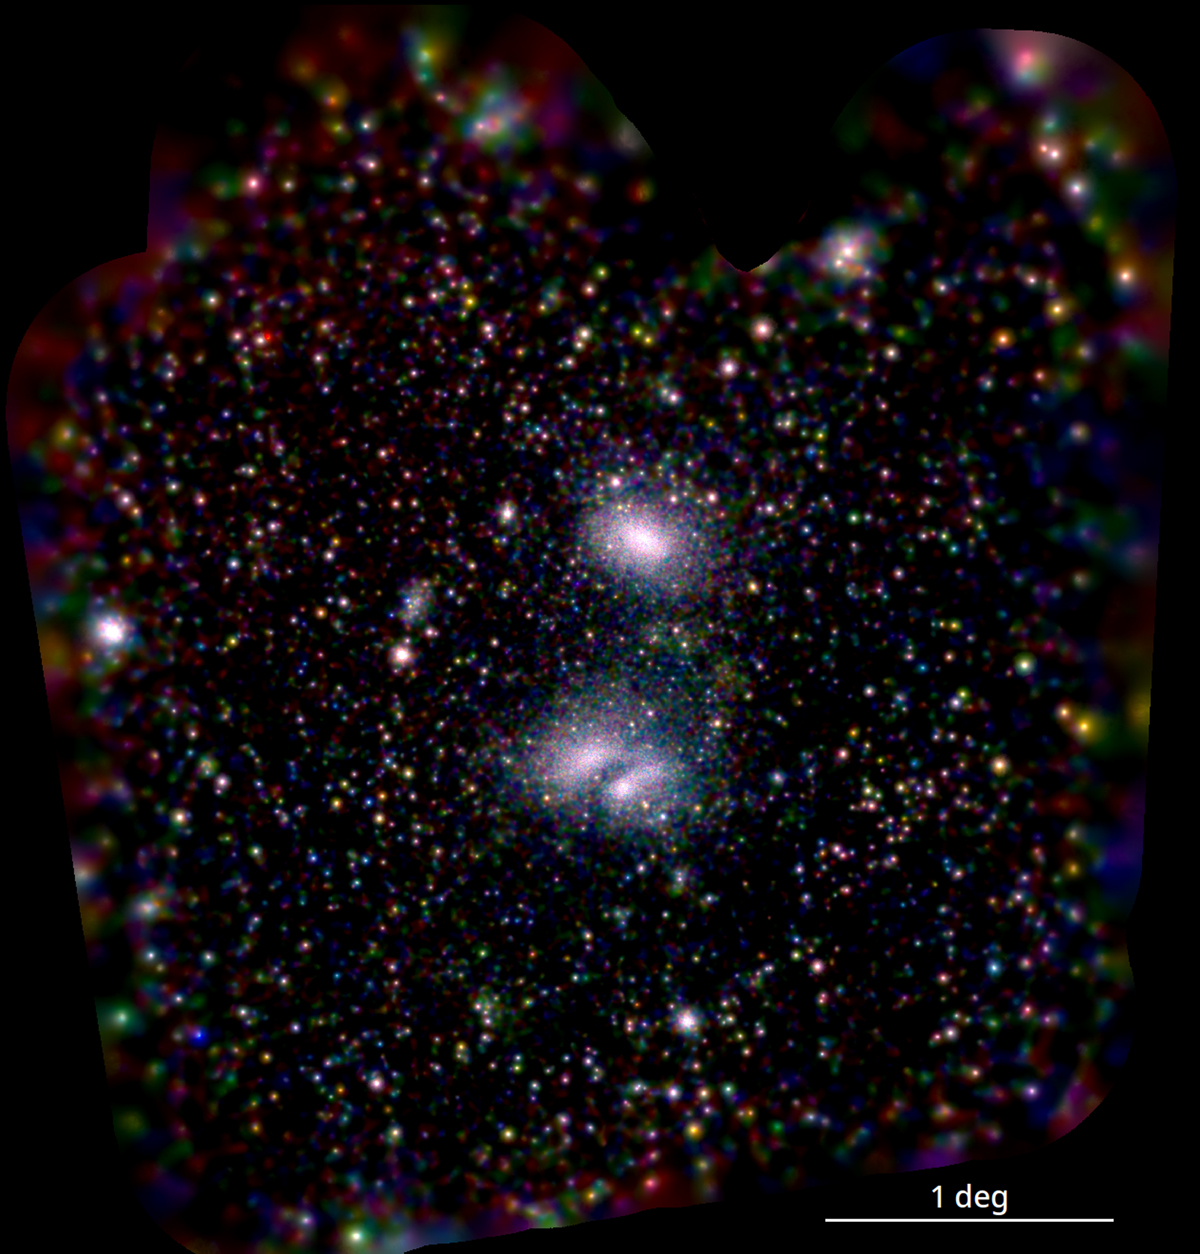
eROSITA RGB image of the A3391/95 system. The red channel corresponds to 0.3–0.75 keV, green to 0.75–1.2 keV, and blue to 1.2–2.3 keV. Since energies below 1 keV are required, only TM8 has been used here. Scans I and II, therefore, have only TM6 included, which has little exposure north of Canopus. Regions with less than 10 s exposure have been excluded here, hence the black area in the north. All shown eROSITA images from now on are exposure- and vignetting-corrected and the particle-induced background has been subtracted. A Gaussian smoothing has been applied which is scaled by the size of a top hat kernel with 25 photon counts in it. In the center of the field, A3391 is the northern large cluster and A3395n and A3395s are the two southern large clusters. One deg at z = 0.0555 (A3391 redshift) corresponds to ~3.9 Mpc.
Current usage metrics show cumulative count of Article Views (full-text article views including HTML views, PDF and ePub downloads, according to the available data) and Abstracts Views on Vision4Press platform.
Data correspond to usage on the plateform after 2015. The current usage metrics is available 48-96 hours after online publication and is updated daily on week days.
Initial download of the metrics may take a while.