Fig. C.3
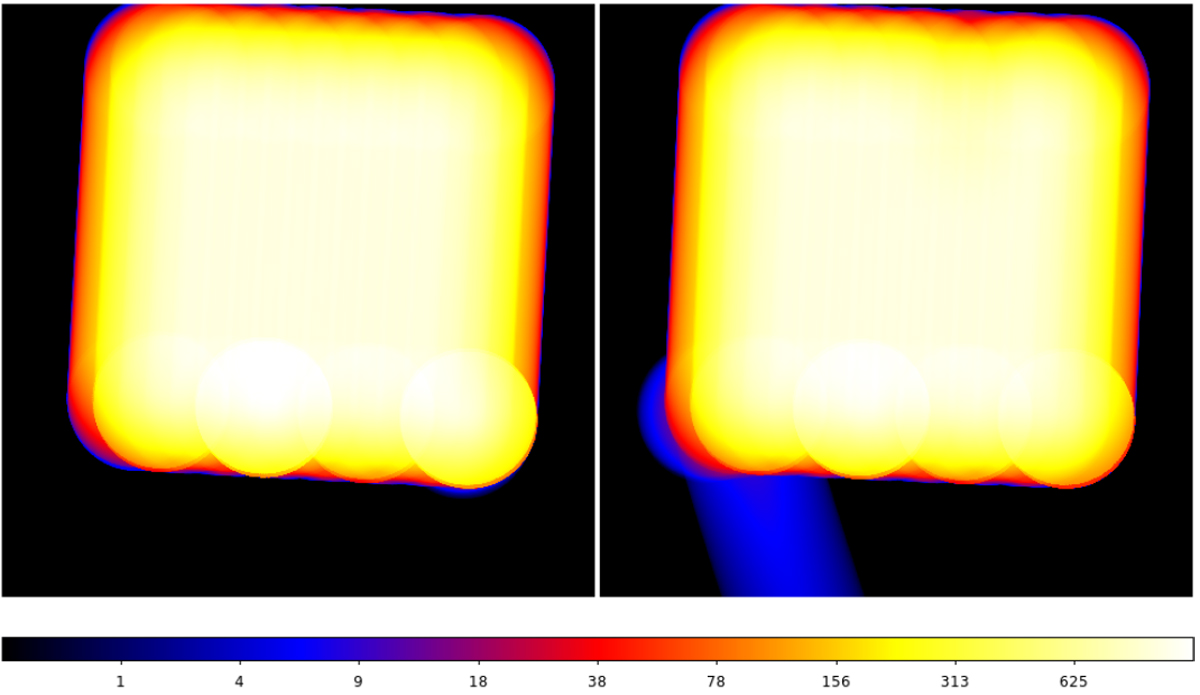
Exposure maps (in seconds) of TM9 for observations 300005 (left) and 300006 (right) shown in logarithmic scale. The blue line at the bottom of observation 300006 indicates the starting point of the scan.
Current usage metrics show cumulative count of Article Views (full-text article views including HTML views, PDF and ePub downloads, according to the available data) and Abstracts Views on Vision4Press platform.
Data correspond to usage on the plateform after 2015. The current usage metrics is available 48-96 hours after online publication and is updated daily on week days.
Initial download of the metrics may take a while.