Fig. 3
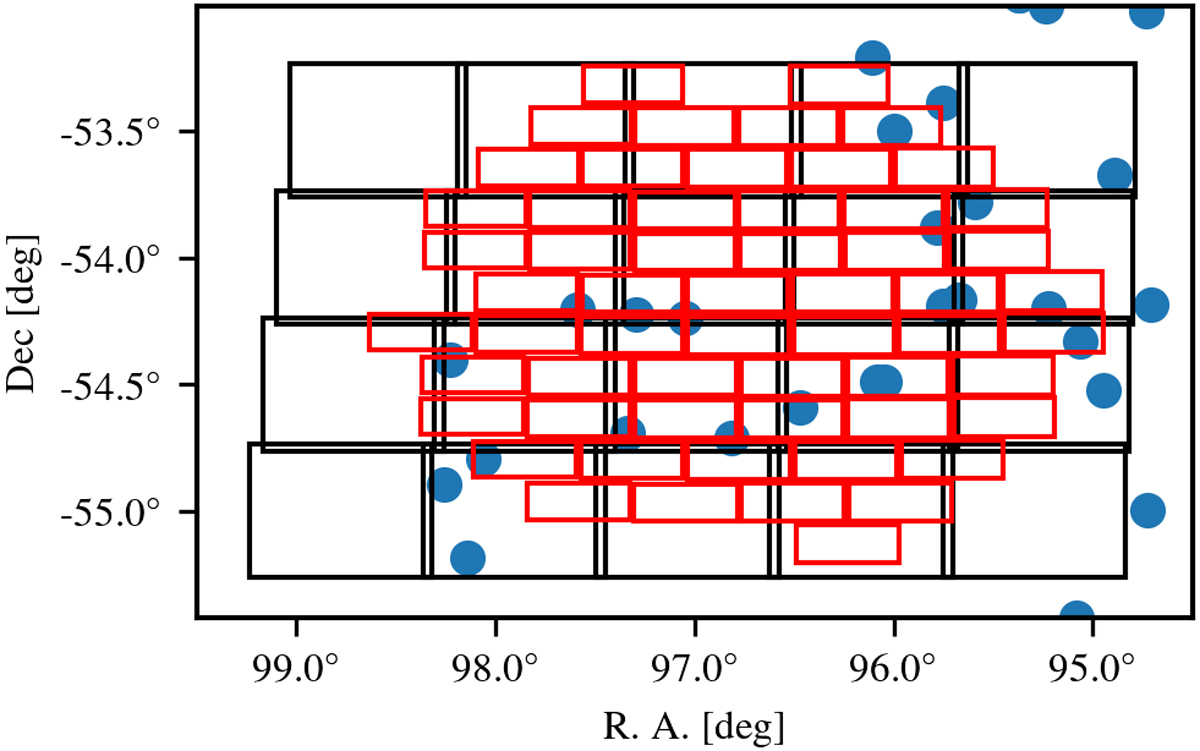
Layout of our DECam tiles with an area of 0.25 square degrees (black squares), the location of individual r-band exposures (blue dots), and the chips of one 62-chip raw DECam image (some chips are missing due to very bright sources or technical problems).
Current usage metrics show cumulative count of Article Views (full-text article views including HTML views, PDF and ePub downloads, according to the available data) and Abstracts Views on Vision4Press platform.
Data correspond to usage on the plateform after 2015. The current usage metrics is available 48-96 hours after online publication and is updated daily on week days.
Initial download of the metrics may take a while.