Fig. 2
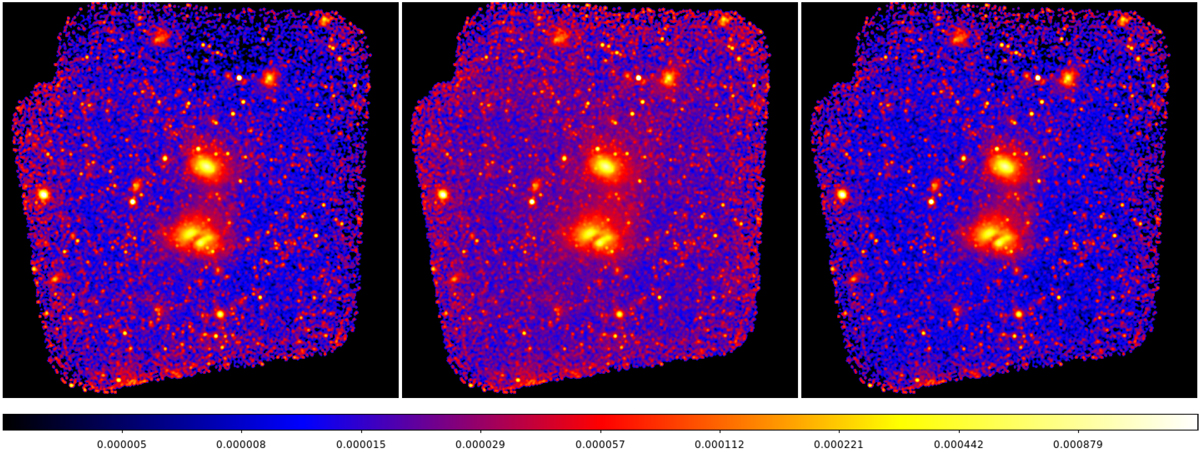
Vignetting-corrected count rate images of combined observations in energy band 0.3–2.0 keV for TM8 and 1.0–2.0 keV for TM9. Left: PIB-subtracted but without correction factor applied to the TM9 exposure map. For visualization purposes, this image has been normalized such that the peak values of A3391 in this image and the final image (right) have the same color. Middle: without PIB-subtraction but with TM9 exposure correction. Right: PIB-subtracted and with TM9 exposure correction. We note that, after correction, edge effects and exposure loss effects due to the optically bright star Canopus (the brightest spot in the north) are strongly reduced. The image on the right is the final image after all corrections. The enhanced emission towards the lower left is real and due to a galaxy cluster just outside the covered field, but clearly visible in eRASS:1.
Current usage metrics show cumulative count of Article Views (full-text article views including HTML views, PDF and ePub downloads, according to the available data) and Abstracts Views on Vision4Press platform.
Data correspond to usage on the plateform after 2015. The current usage metrics is available 48-96 hours after online publication and is updated daily on week days.
Initial download of the metrics may take a while.