Fig. A.1
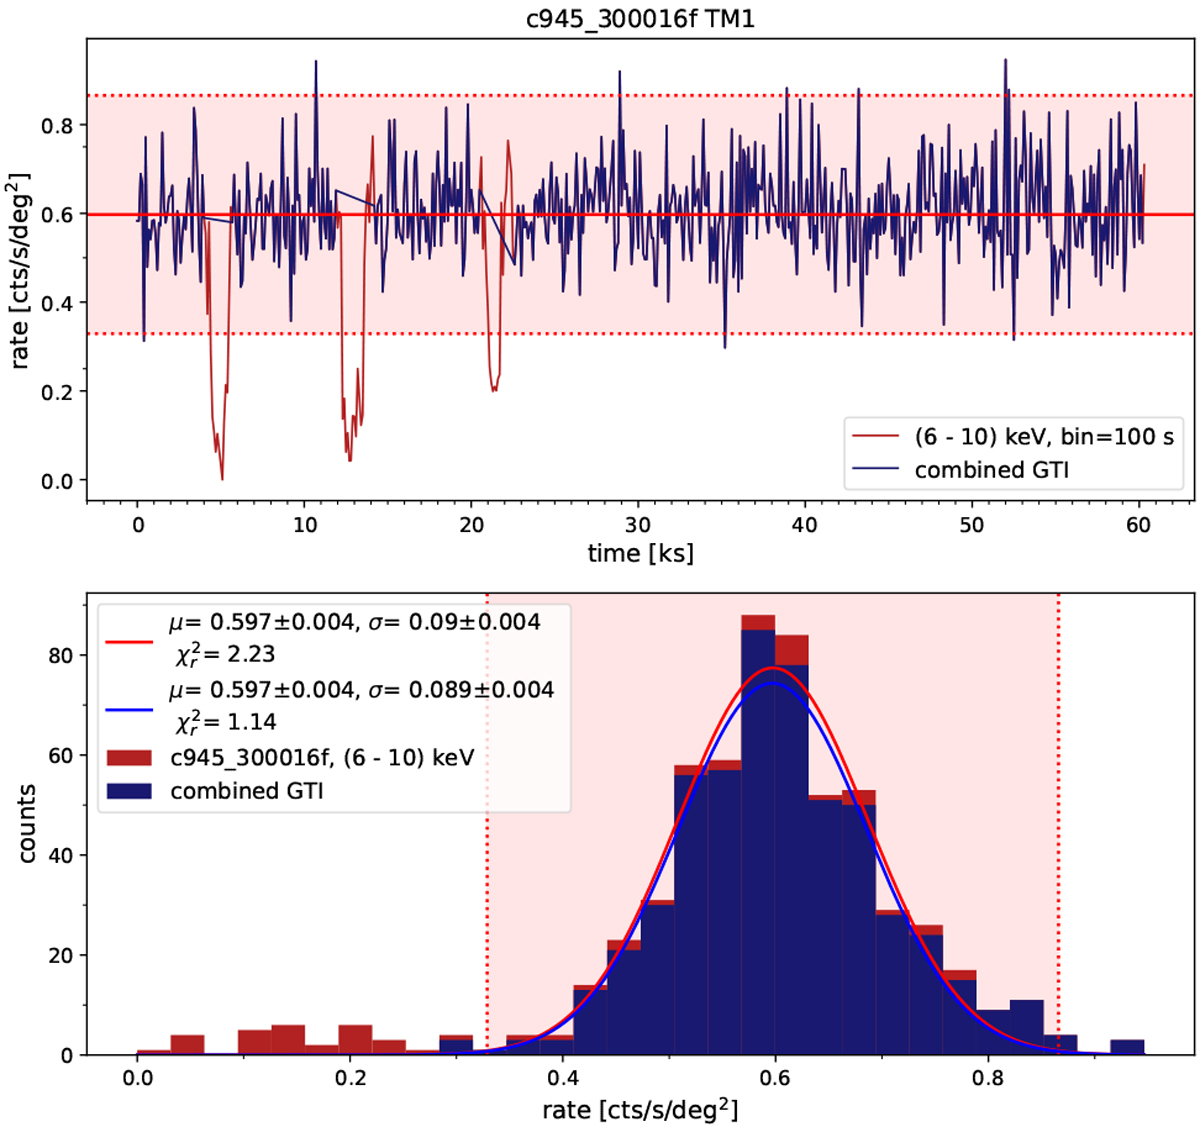
Top: total 6–10 keV light curve of TM1 (red) and the filtered light curve (blue), where eSASS GTIs and manually selected GTIs were combined. Time bins of 100 s were chosen. Dotted lines indicate the 3σ interval for illustration. Bottom: corresponding count rate histograms and Gaussian model fits.
Current usage metrics show cumulative count of Article Views (full-text article views including HTML views, PDF and ePub downloads, according to the available data) and Abstracts Views on Vision4Press platform.
Data correspond to usage on the plateform after 2015. The current usage metrics is available 48-96 hours after online publication and is updated daily on week days.
Initial download of the metrics may take a while.