Fig. 16
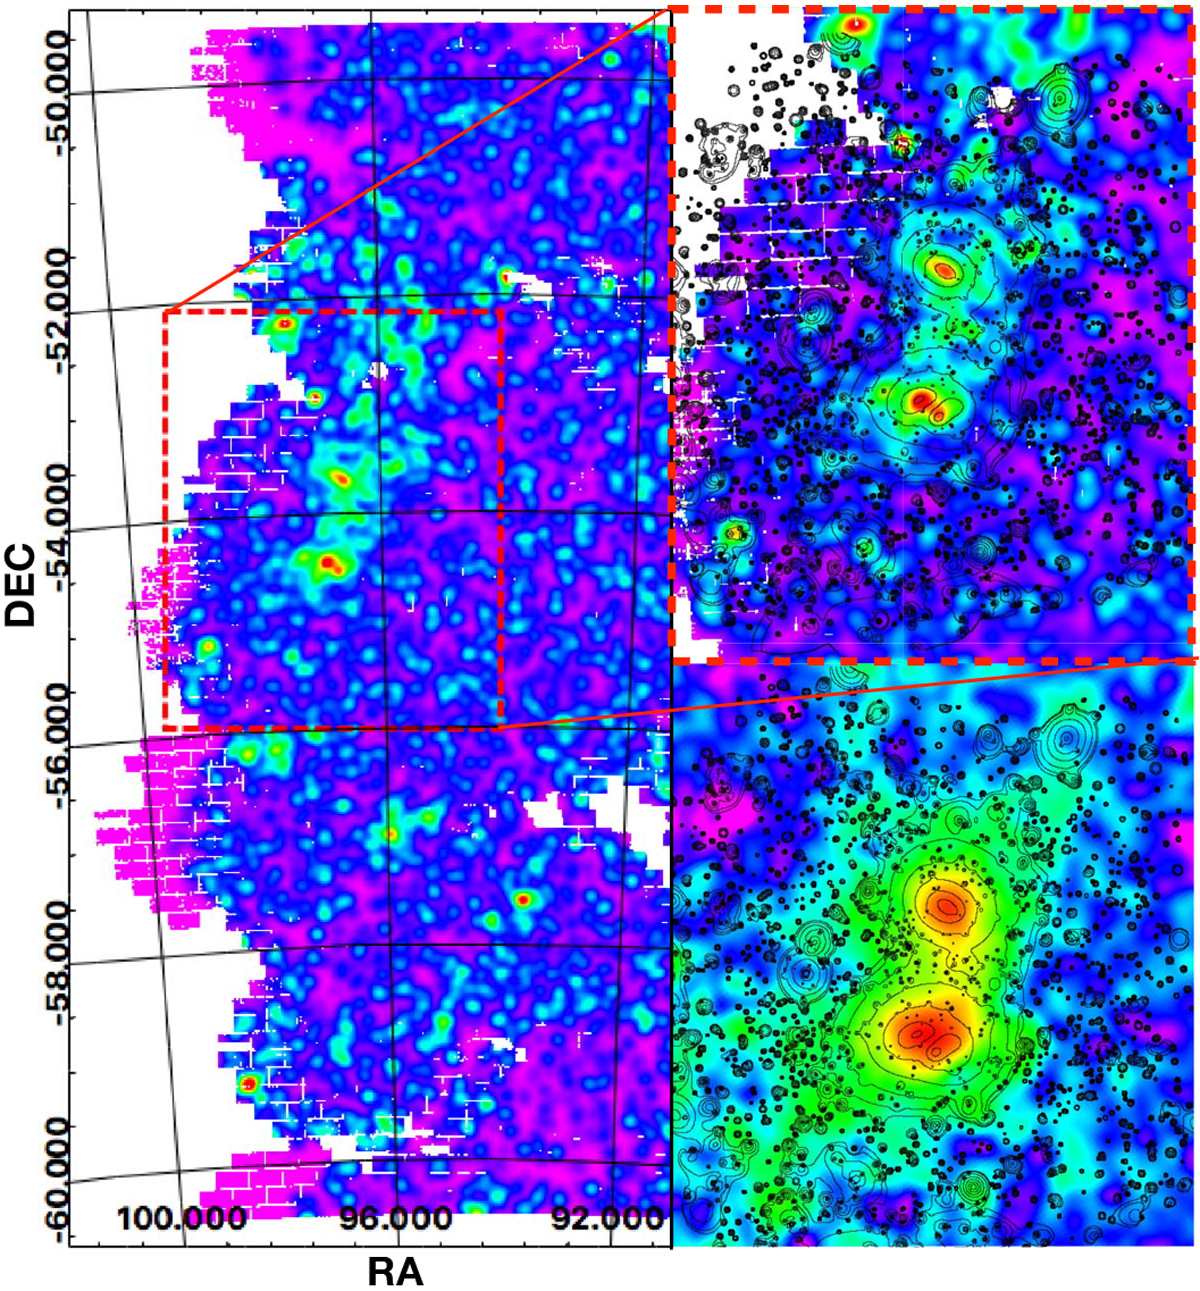
Left: large-scale DECam galaxy density map of the A3391/95 system. Right/top: zoom into the DECam galaxy density map. Overlaid are contours from the eROSITA wavelet-filtered image. Right/bottom: Planck y-map on the samespatial scale as in the top image, also with eROSITA contours.
Current usage metrics show cumulative count of Article Views (full-text article views including HTML views, PDF and ePub downloads, according to the available data) and Abstracts Views on Vision4Press platform.
Data correspond to usage on the plateform after 2015. The current usage metrics is available 48-96 hours after online publication and is updated daily on week days.
Initial download of the metrics may take a while.