Fig. 13
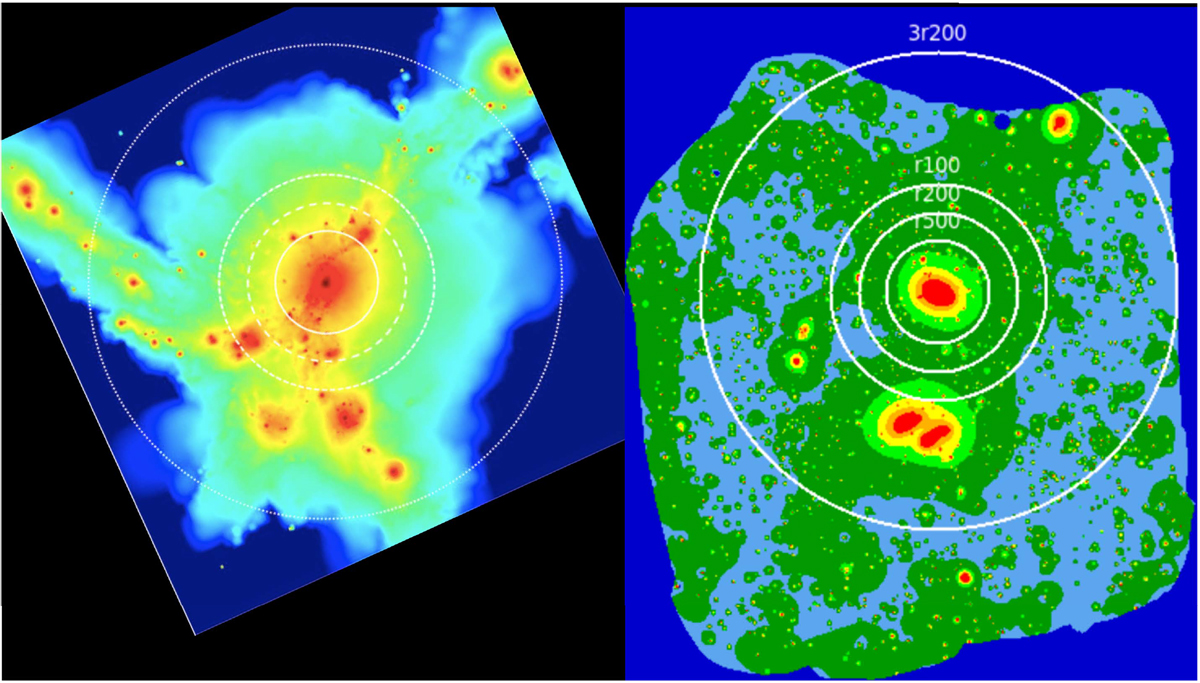
Left: illustration of various radii of interest overlaid on the gas density distribution of a merging cluster from a hydrodynamic simulation (rotated to appear similar to the A3391/95 structures, from Reiprich et al. 2013; Roncarelli et al. 2006). Right: eROSITA wavelet-filtered image as in Fig. 5 but removing all areas with less than 1 ks effective exposure and using a color scheme to highlight low-surface-brightness features. Overlaid are the same radii for A3391 as shown on the left for the simulated cluster.
Current usage metrics show cumulative count of Article Views (full-text article views including HTML views, PDF and ePub downloads, according to the available data) and Abstracts Views on Vision4Press platform.
Data correspond to usage on the plateform after 2015. The current usage metrics is available 48-96 hours after online publication and is updated daily on week days.
Initial download of the metrics may take a while.