Fig. 12
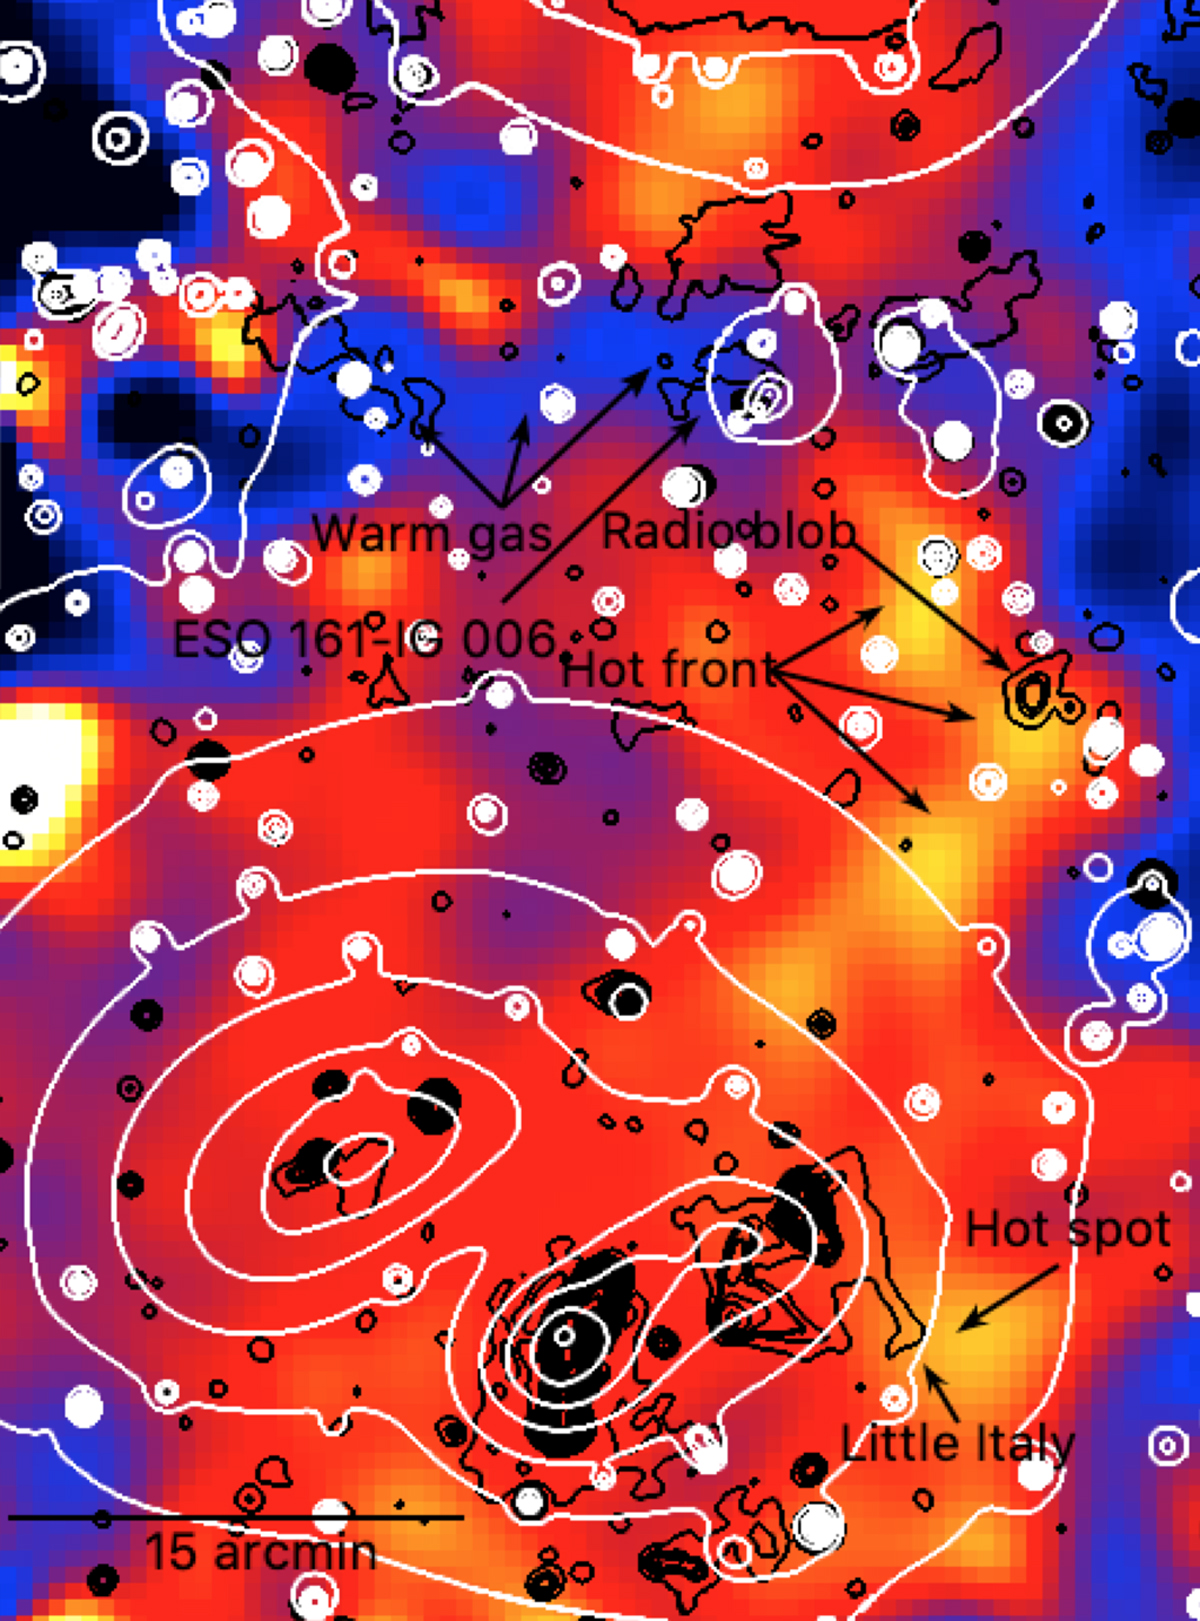
Oxygen band image of the A3391/95 emission bridge region. White contours are from the eROSITA wavelet-filtered image and black contours from the ASKAP/EMU radio image. We note the increased OVII+OVIII (warm) emission in blue in the middle of the main emission bridge. We also note the regions of apparently hotter gas (yellow), some of which are close to potentially interesting radio features (the southern “Little Italy” extension of S3 and the “Radio blob” near the “Hot front” whichhas no optical counterpart).
Current usage metrics show cumulative count of Article Views (full-text article views including HTML views, PDF and ePub downloads, according to the available data) and Abstracts Views on Vision4Press platform.
Data correspond to usage on the plateform after 2015. The current usage metrics is available 48-96 hours after online publication and is updated daily on week days.
Initial download of the metrics may take a while.