Fig. 11
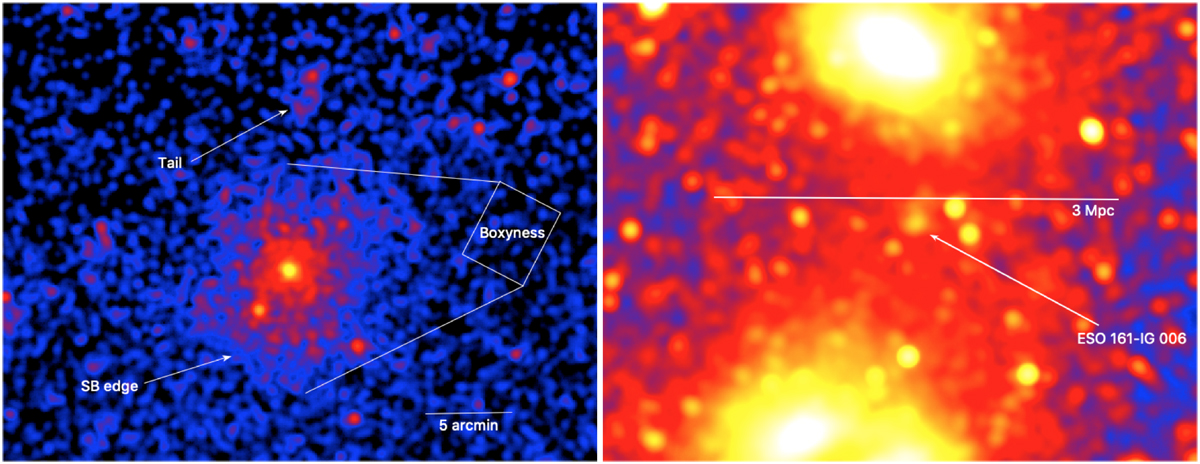
Gaussian smoothed versions of the eROSITA count rate image. Left: zoom in to the apparently infalling Northern Clump, hosting a bright WAT (F2, see Fig. 9). Right: zoom in to the emission bridge between A3391 and A3395. Three Mpc correspond to 46′.
Current usage metrics show cumulative count of Article Views (full-text article views including HTML views, PDF and ePub downloads, according to the available data) and Abstracts Views on Vision4Press platform.
Data correspond to usage on the plateform after 2015. The current usage metrics is available 48-96 hours after online publication and is updated daily on week days.
Initial download of the metrics may take a while.