Fig. 1
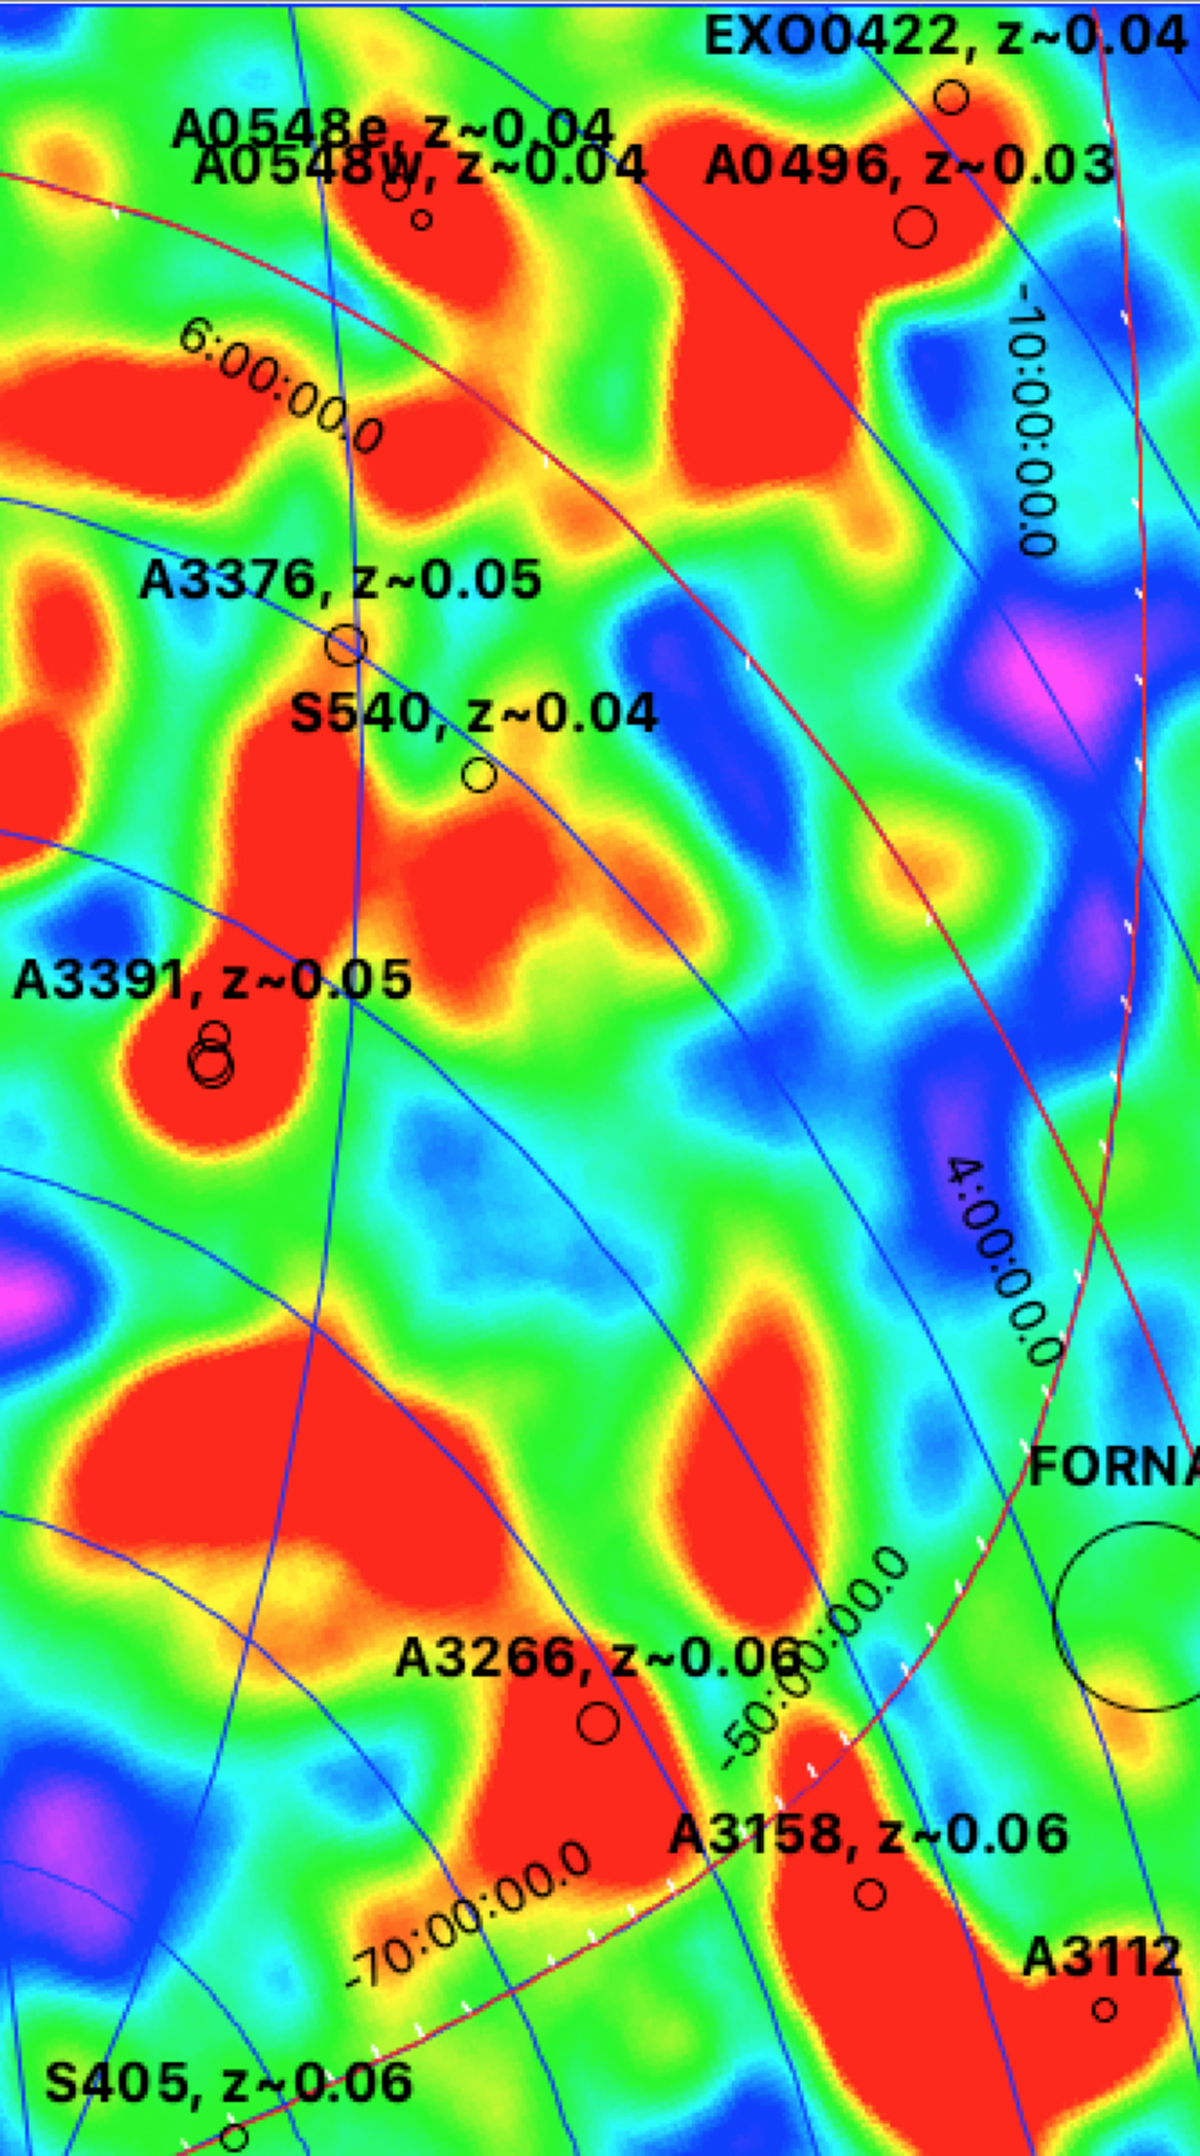
Smoothed large-scale 2MASS extended source map (Jarrett et al. 2000). At RA = 06H this map covers more than 60 deg in Dec. High galaxy number density is shown in red, with low density in blue. Overlaid are positions and apparent sizes of X-ray-selected clusters from the HIFLUGCS sample (Reiprich & Böhringer 2002; Reiprich et al. 2003). The A3391/95n/s system is in the middle-left part of the image (three circles, only A3391 is labeled). Similar overdensities to those visible in this distribution of a large number of near-infrared selected galaxies are also very prominently traced by just a handful of X-ray-selected clusters. There is an indication of a large north–south galaxy filament going right through A3391/95.
Current usage metrics show cumulative count of Article Views (full-text article views including HTML views, PDF and ePub downloads, according to the available data) and Abstracts Views on Vision4Press platform.
Data correspond to usage on the plateform after 2015. The current usage metrics is available 48-96 hours after online publication and is updated daily on week days.
Initial download of the metrics may take a while.