Fig. 5
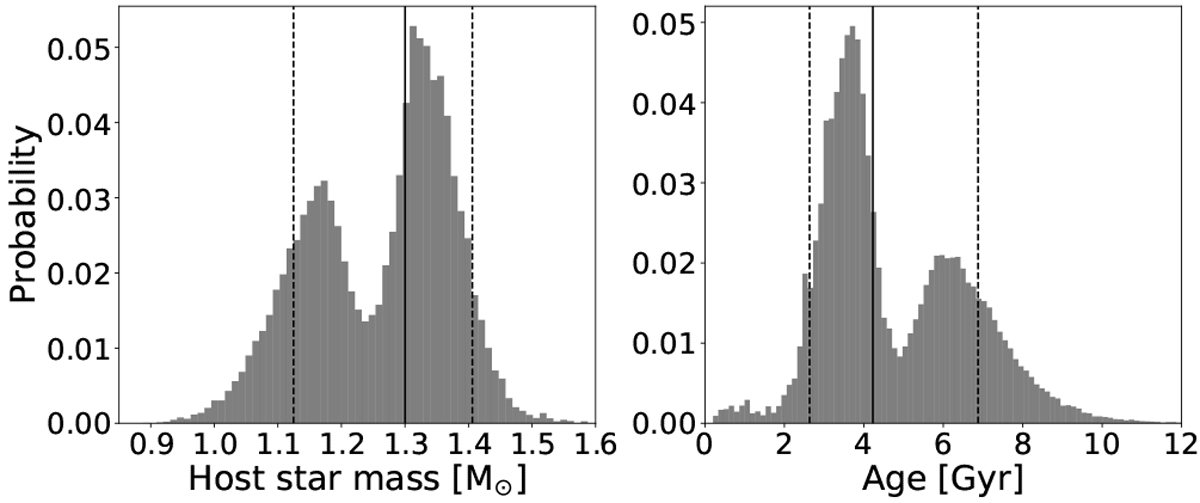
Stellar mass and age posterior distributions from EXOFASTv2. These distributions show the relative probabilitybetween the two peaks of the bimodal distributions, which is approximately 60 to 40% in favor of a more massive, younger system. We split the stellar mass distribution in the valley at 1.25 M⊙ to create the two solutions presented in Table 4. For our final solution, we adopt the median value (vertical black lines) and upper and lower boundaries (dashed vertical lines) of the 68% confidence intervals we computed, as describedin Sect. 3.2.1.
Current usage metrics show cumulative count of Article Views (full-text article views including HTML views, PDF and ePub downloads, according to the available data) and Abstracts Views on Vision4Press platform.
Data correspond to usage on the plateform after 2015. The current usage metrics is available 48-96 hours after online publication and is updated daily on week days.
Initial download of the metrics may take a while.