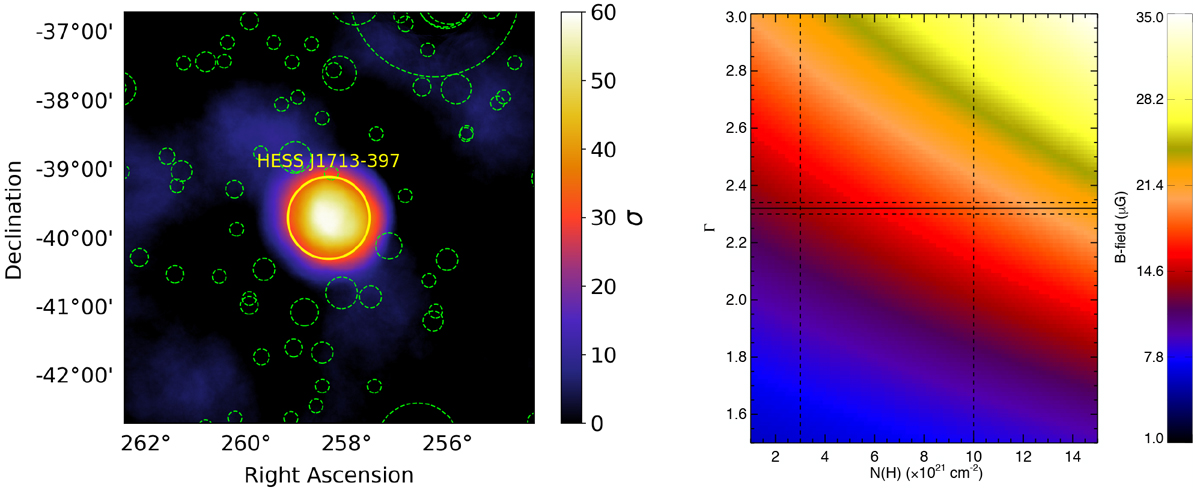
Fig. C.1

Left: ROSAT/PSPC significance map using the reflected background method and a correlation radius of Rspec = 0.6° (represented by a yellow circle). The dashed green circles are the 1RXS and 2RXS sources that have been masked in the ROSAT/PSPC count map (0.9–2.4 keV). Right: mean magnetic field as a function of the TeV photon spectral index and the column density. Thefull and dashed horizontal lines are the TeV spectral index and its associated statistical errors, as reported in the HGPS. The vertical dashed lines correspond to the column density range derived from Sano et al. (2015).
Current usage metrics show cumulative count of Article Views (full-text article views including HTML views, PDF and ePub downloads, according to the available data) and Abstracts Views on Vision4Press platform.
Data correspond to usage on the plateform after 2015. The current usage metrics is available 48-96 hours after online publication and is updated daily on week days.
Initial download of the metrics may take a while.


