Fig. 3.
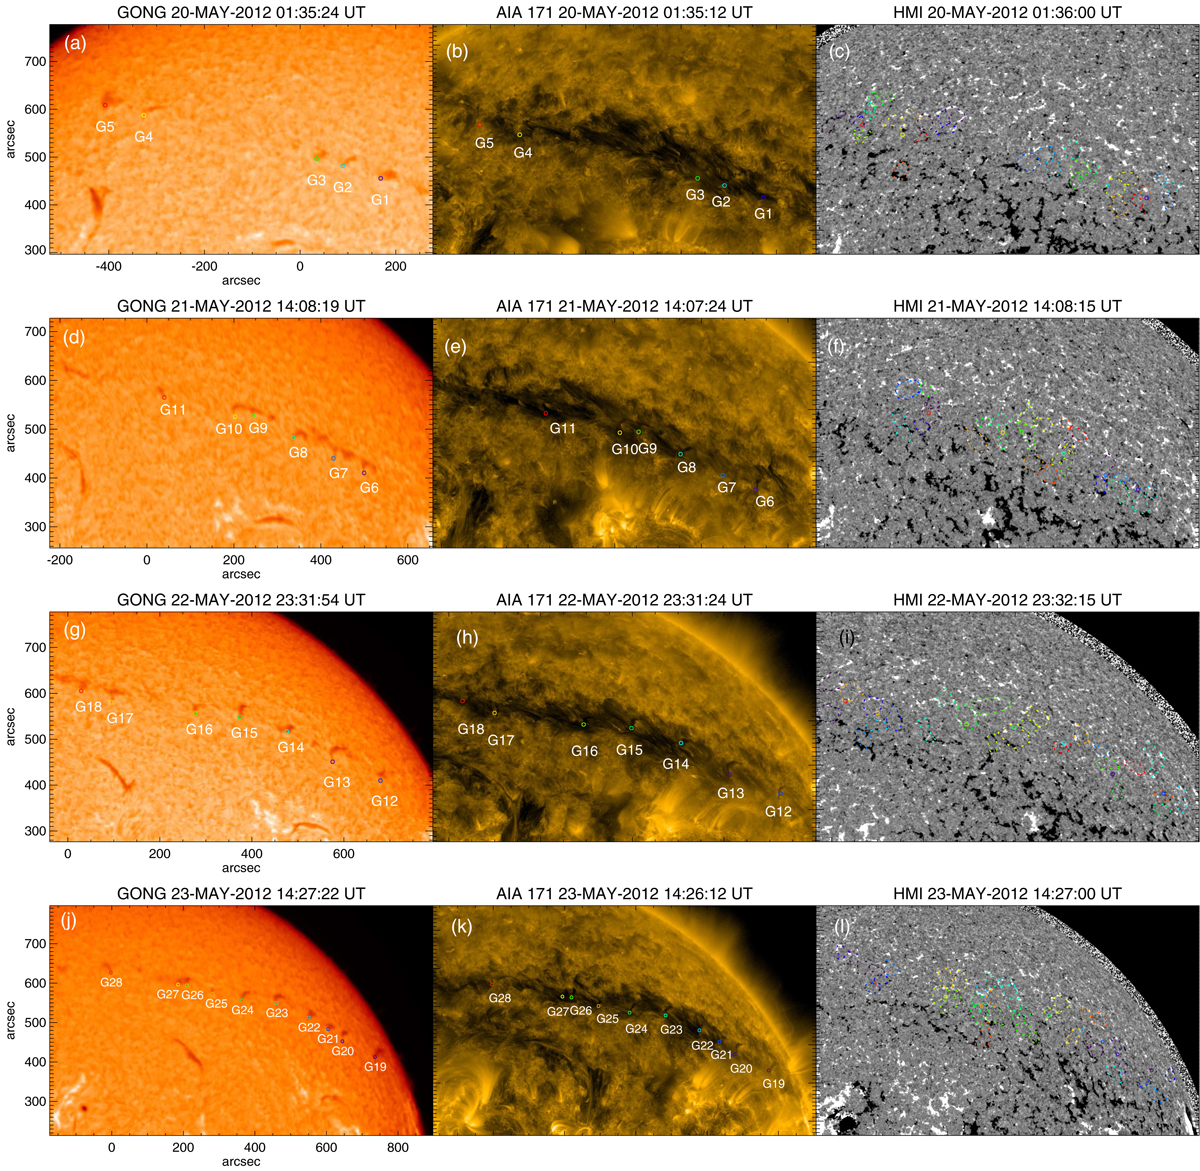
Time sequence of prominence PA in GONG Hα images, AIA 171 Å images in log scale, and Gaussian smoothed HMI LOS magnetograms on May 20 (a–c), May 21 (d–f), May 22 (g–i), and May 23 (j–l) in 2012. The small circles in different colors show the location of the footpoints of the prominence legs. The diameter of these circles is 8 arcsec (about 5800 km). The magnetograms are shown in gray saturated at ±30 G. Supergranular boundaries are indicated by dashed lines in different colors connecting strong magnetic elements in the HMI magnetograms.
Current usage metrics show cumulative count of Article Views (full-text article views including HTML views, PDF and ePub downloads, according to the available data) and Abstracts Views on Vision4Press platform.
Data correspond to usage on the plateform after 2015. The current usage metrics is available 48-96 hours after online publication and is updated daily on week days.
Initial download of the metrics may take a while.