Fig. 13.
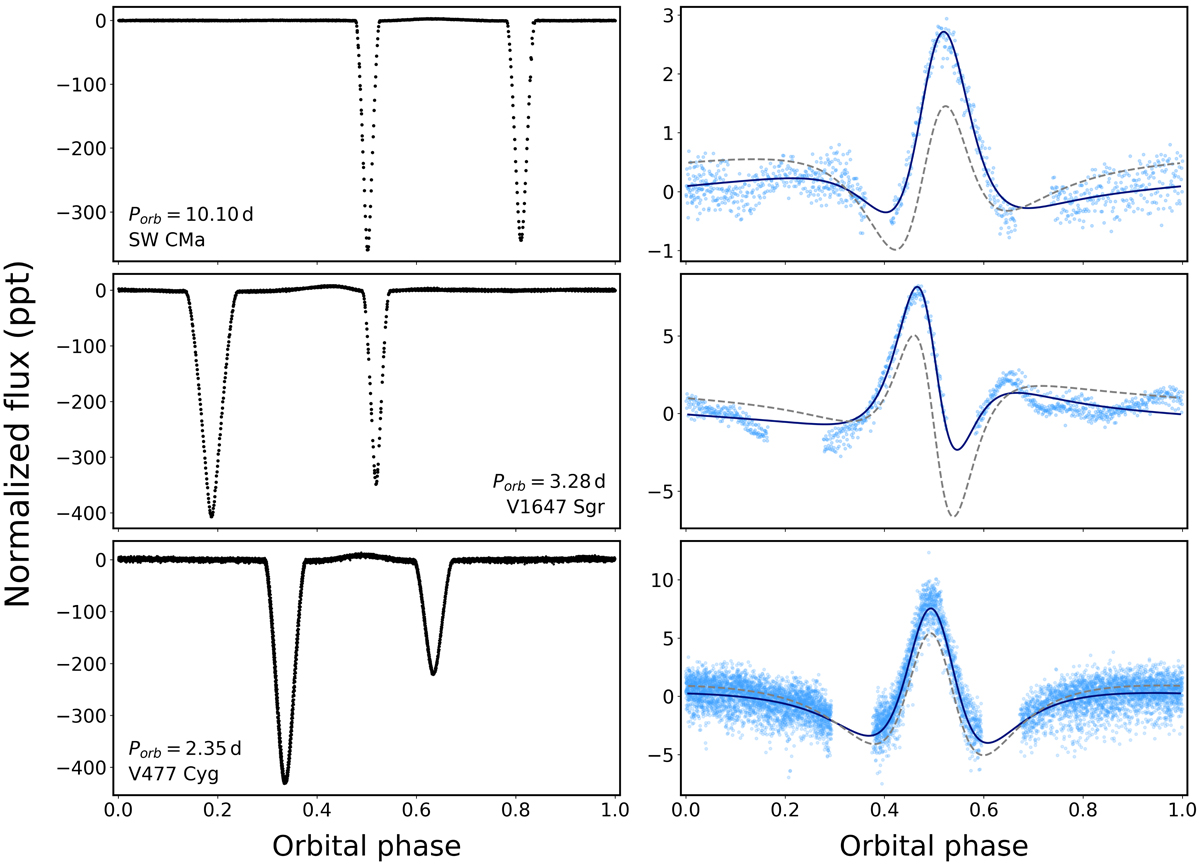
TESS light curves of SW CMa (top), V1647 Sgr (middle), and V477 Cyg (bottom). Left: TESS light curves phased with the orbital periods. Phase 0.5 corresponds to the epoch of the periastron passage. Right: zoom of the light curve after cutting out the eclipses. Continuous dark blue line is the fitted Kumar’s model. For comparison, the dashed line shows the fit of Kumar’s model with inclination fixed at the value given in Table A.1.
Current usage metrics show cumulative count of Article Views (full-text article views including HTML views, PDF and ePub downloads, according to the available data) and Abstracts Views on Vision4Press platform.
Data correspond to usage on the plateform after 2015. The current usage metrics is available 48-96 hours after online publication and is updated daily on week days.
Initial download of the metrics may take a while.