Fig. 12.
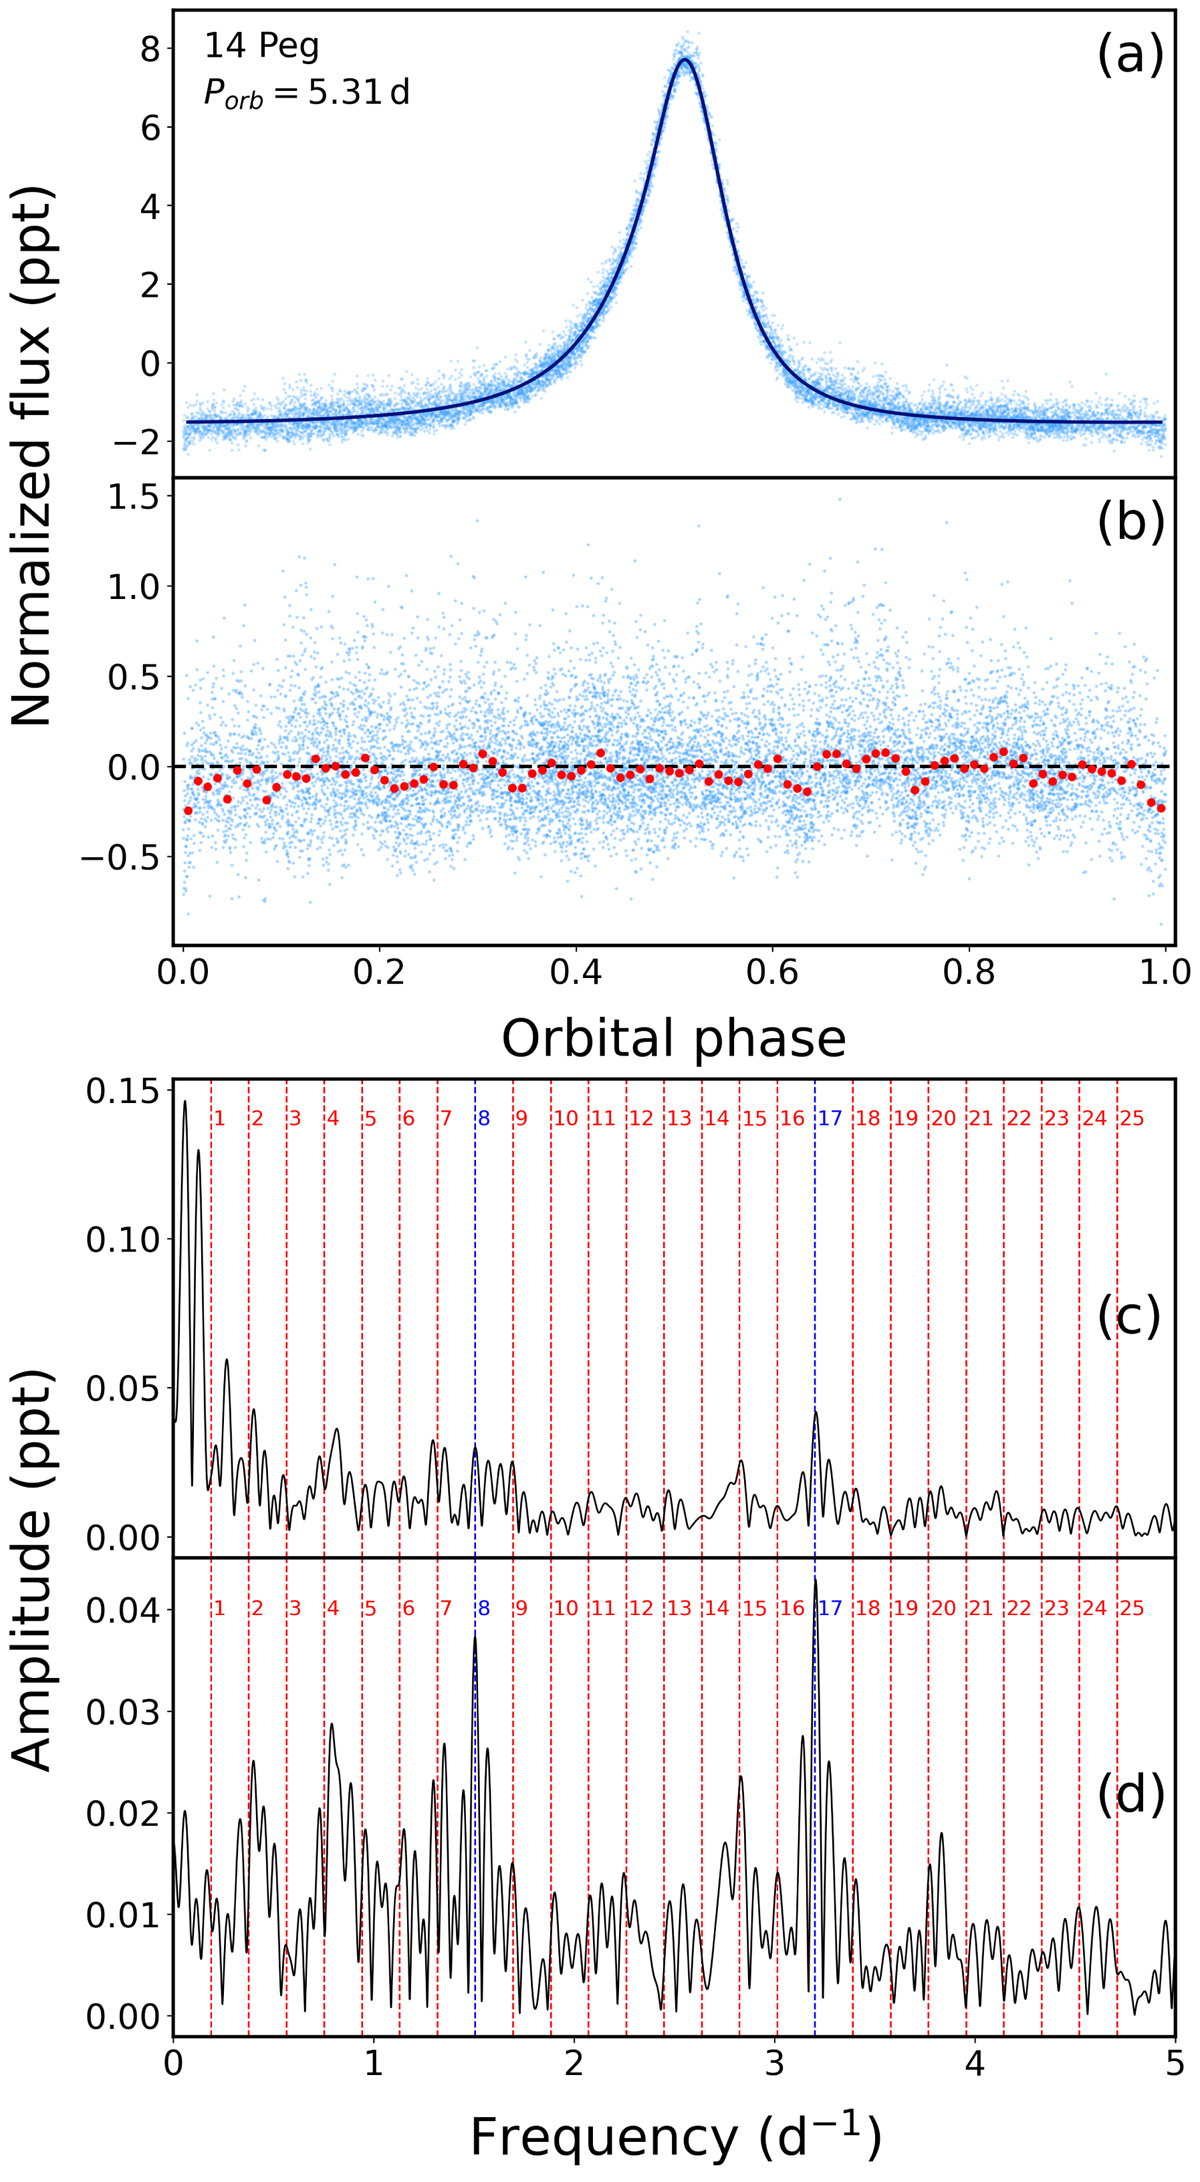
TESS light curves and frequency spectra of 14 Peg: (a) TESS light curve phased with the orbital period. Phase 0.5 corresponds to the epoch of the periastron passage. (b) Residuals from the fit of Kumar’s model. Red dots are median values in 0.01 phase bins. (c) Frequency spectrum of the light curve shown in panel b. Panels c and d: orbital harmonics are marked with red vertical dashed lines (except for TEOs, which are marked with blue) and labeled with n. (d) Same as in panel c but after removing instrumental trend.
Current usage metrics show cumulative count of Article Views (full-text article views including HTML views, PDF and ePub downloads, according to the available data) and Abstracts Views on Vision4Press platform.
Data correspond to usage on the plateform after 2015. The current usage metrics is available 48-96 hours after online publication and is updated daily on week days.
Initial download of the metrics may take a while.