Fig. 10.
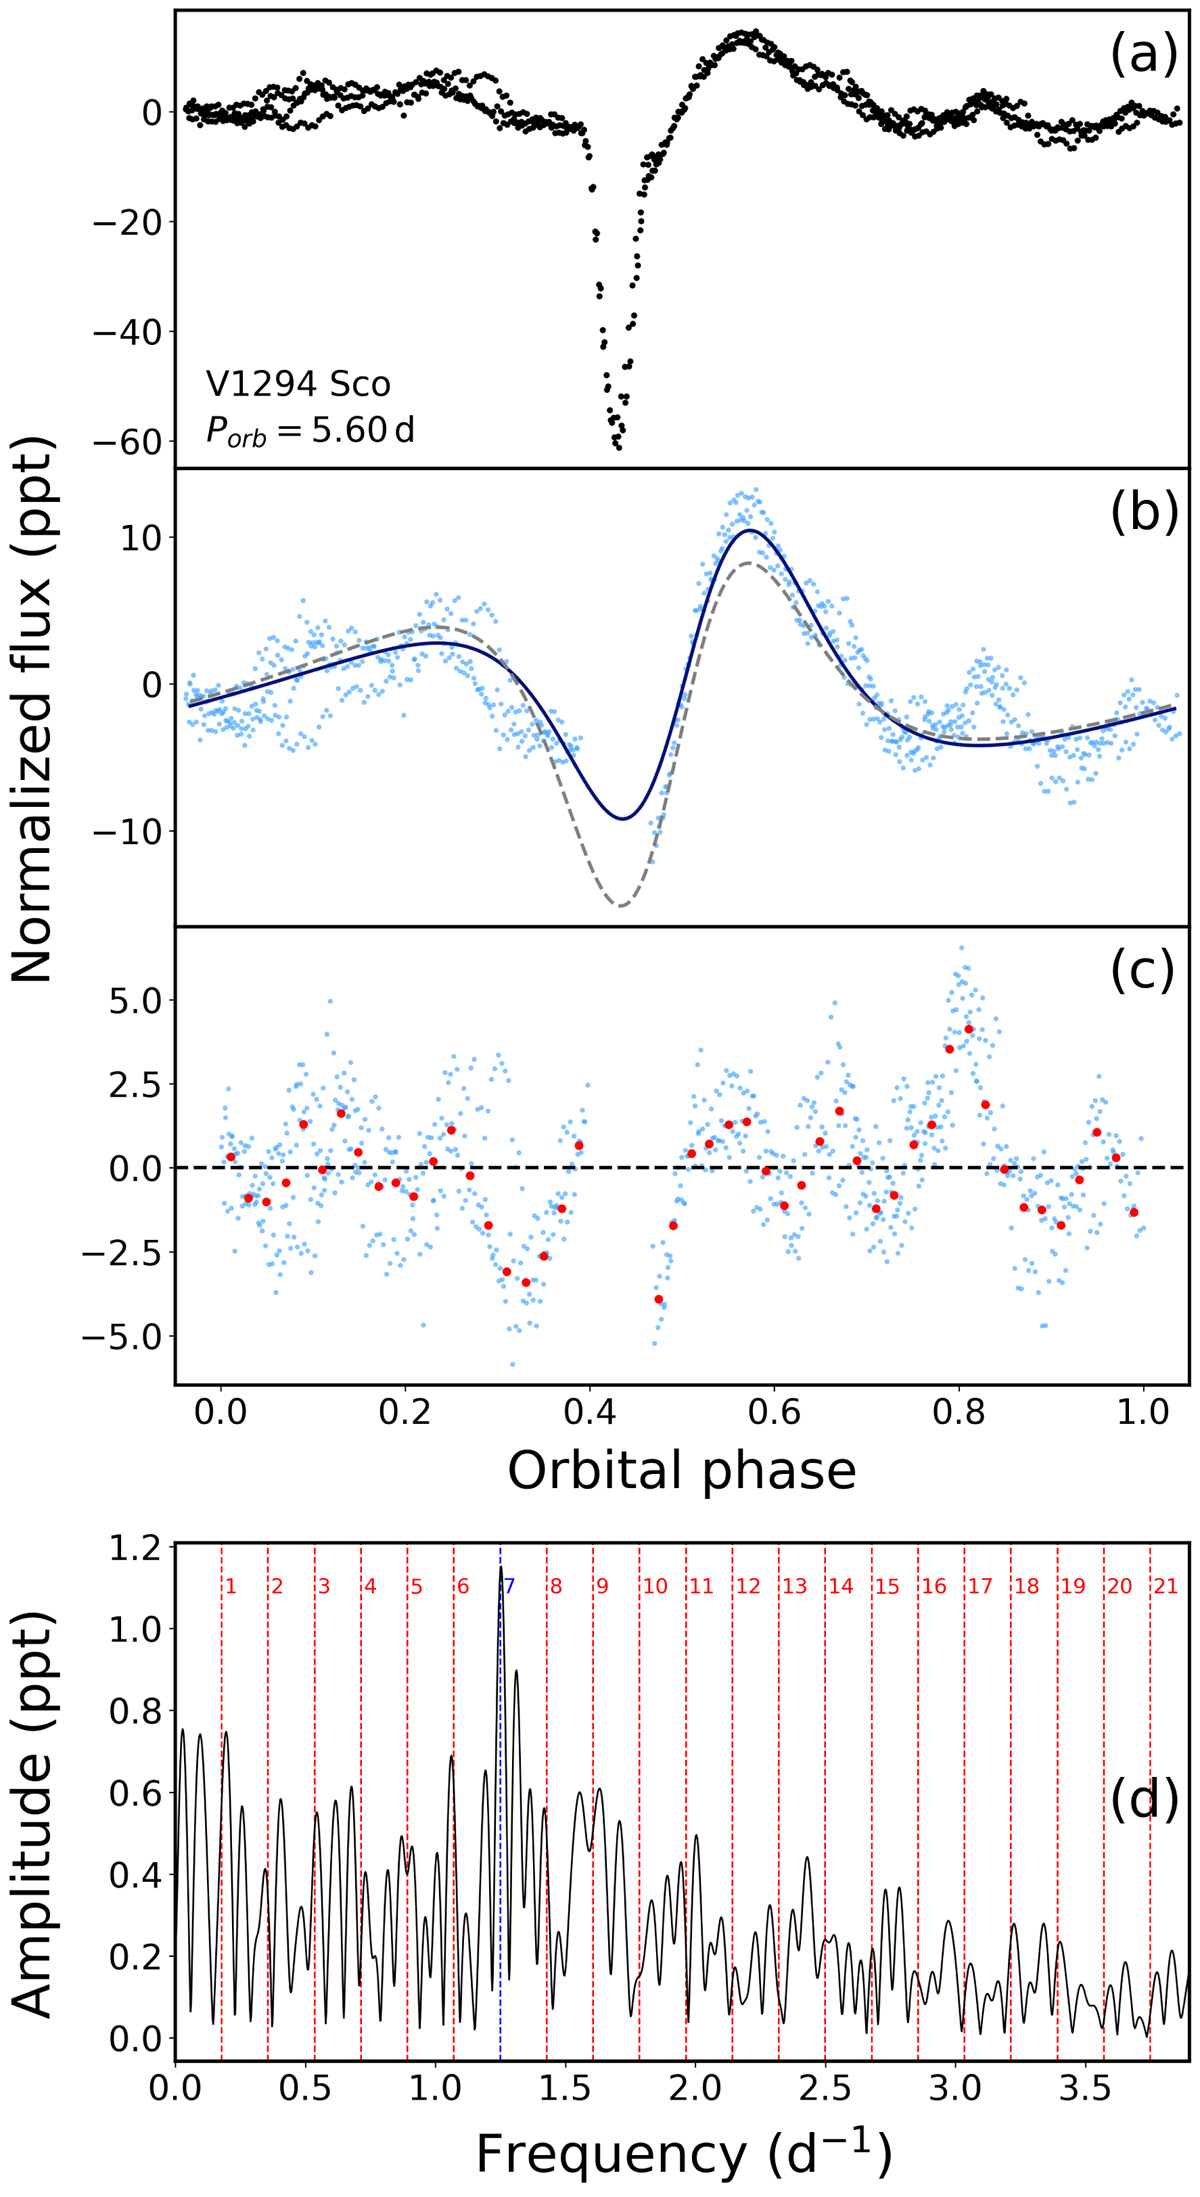
TESS light curves and frequency spectrum of V1294 Sco: (a) TESS light curve phased with the orbital period. Phase 0.5 corresponds to the epoch of the periastron passage. (b) Zoom of the light curve after cutting out the eclipses. The continuous dark blue line is the fitted Kumar’s model. For comparison, the dashed line shows the fit of Kumar’s model with inclination fixed at the value derived by Rauw et al. (2016). (c) Residuals from the fit of Kumar’s model. The red dots are median values in 0.02 phase bins. Grey stripe marks phases in the vicinity of the heartbeat. (d) Frequency spectrum of the light curve shown in panel b. Orbital harmonics are marked with red vertical dashed lines (except for the TEO at n = 7, which is marked with blue). Orbital harmonics and labeled with n.
Current usage metrics show cumulative count of Article Views (full-text article views including HTML views, PDF and ePub downloads, according to the available data) and Abstracts Views on Vision4Press platform.
Data correspond to usage on the plateform after 2015. The current usage metrics is available 48-96 hours after online publication and is updated daily on week days.
Initial download of the metrics may take a while.