Fig. 6.
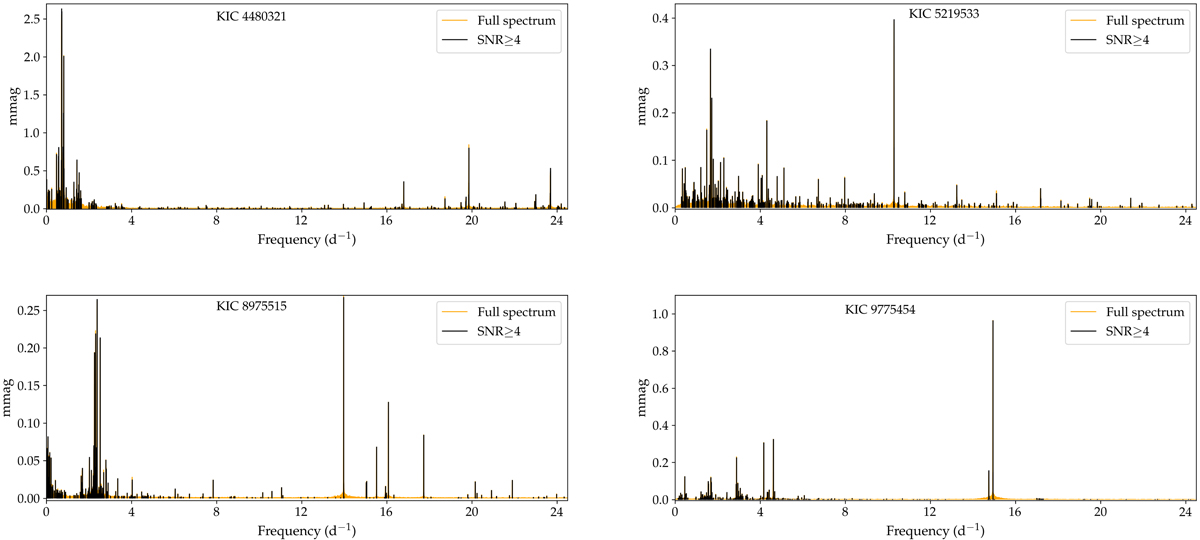
Lomb-Scargle periodograms derived from the Kepler data for the systems KIC 4480321 (top left), 5219533 (top right), 8975515 (bottom left), and KIC 9775454 (bottom right). The frequencies plotted in orange illustrate the full spectrum across the range [0–24.5] d−1, and the frequencies over-plotted in black have a signal-to-noise ratio higher than 4.
Current usage metrics show cumulative count of Article Views (full-text article views including HTML views, PDF and ePub downloads, according to the available data) and Abstracts Views on Vision4Press platform.
Data correspond to usage on the plateform after 2015. The current usage metrics is available 48-96 hours after online publication and is updated daily on week days.
Initial download of the metrics may take a while.