Open Access
Fig. 2.
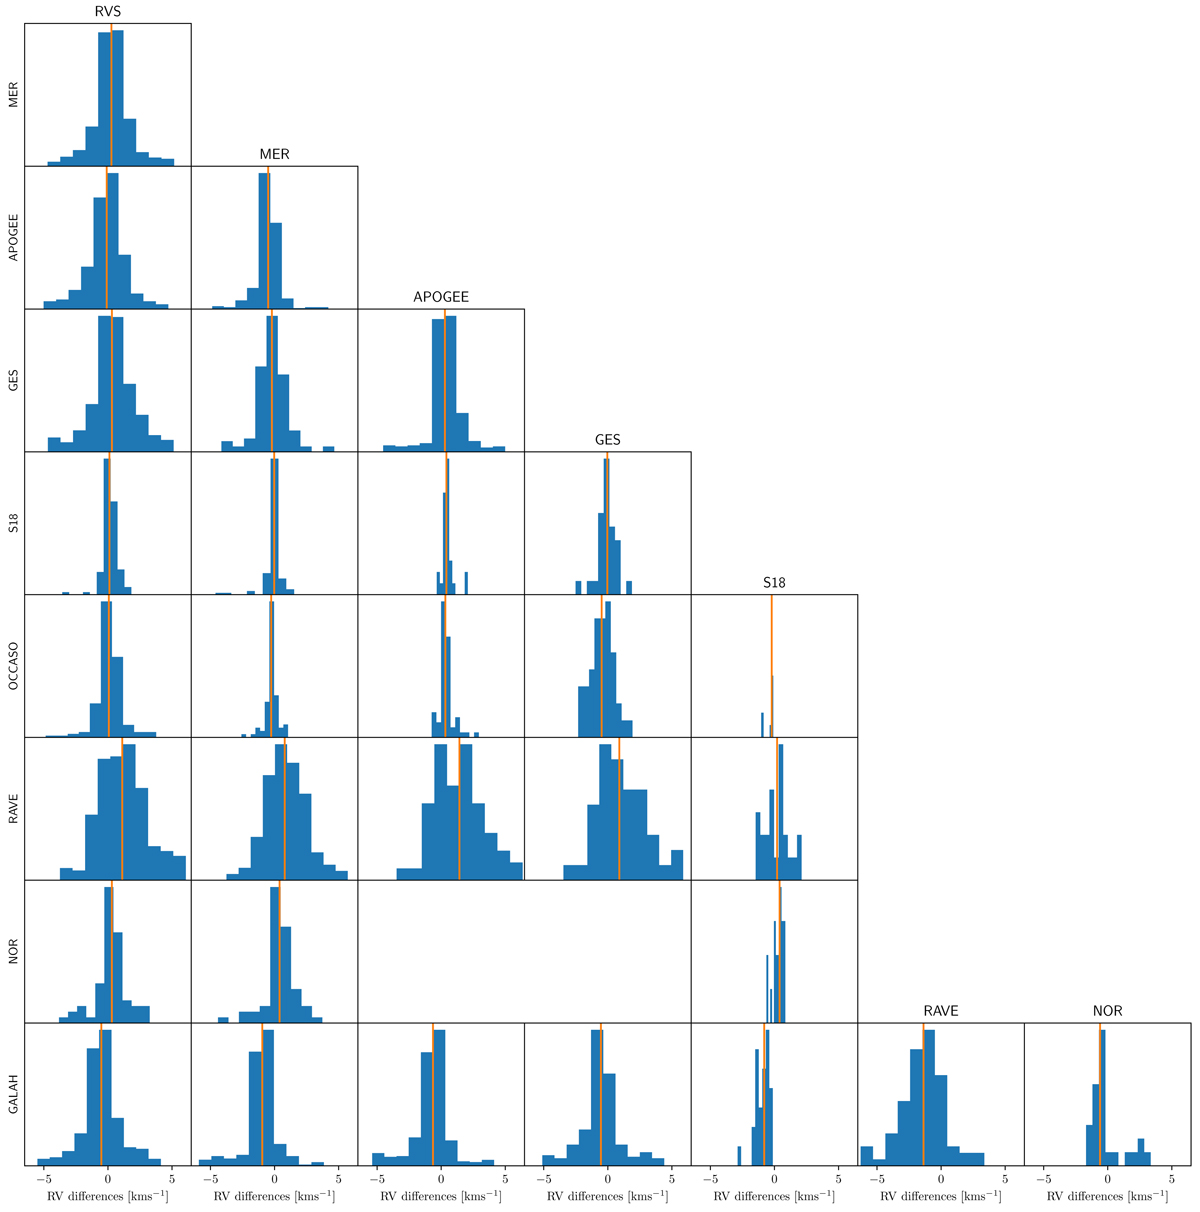
Histograms of the RV difference of stars in common in several surveys (zoomed in the range from −5 to 5 km s−1). The solid orange line corresponds to the median value. The statistics of the comparisons are given in Table 2.
Current usage metrics show cumulative count of Article Views (full-text article views including HTML views, PDF and ePub downloads, according to the available data) and Abstracts Views on Vision4Press platform.
Data correspond to usage on the plateform after 2015. The current usage metrics is available 48-96 hours after online publication and is updated daily on week days.
Initial download of the metrics may take a while.