Fig. 13.
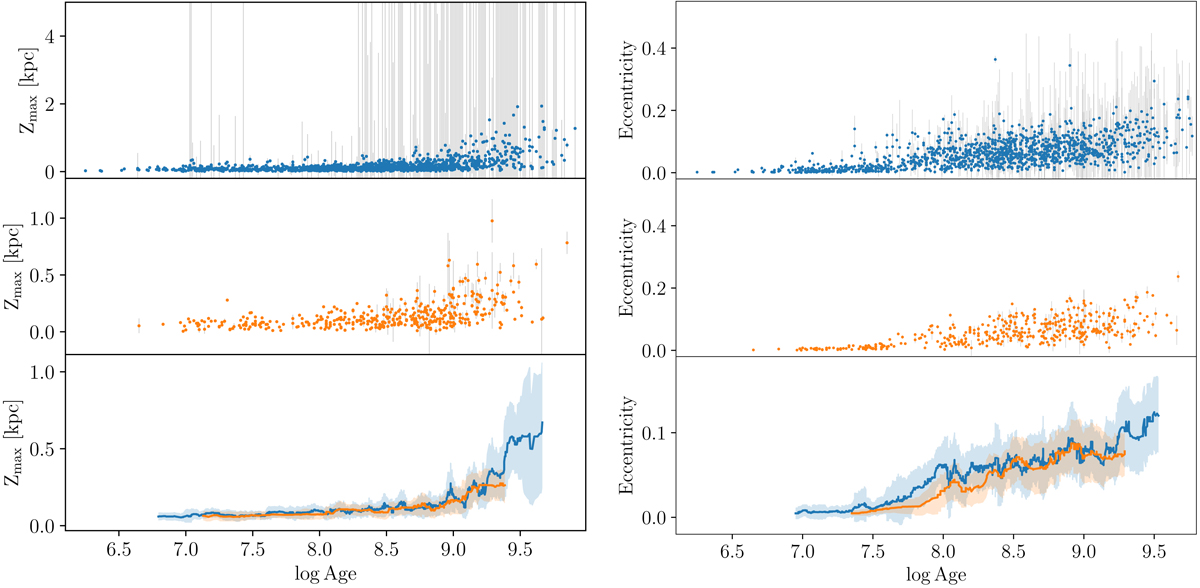
Maximum altitude above the Galactic plane (left) and eccentricity (right) of the clusters for which we could integrate their orbits as a function of age. In both panels, we represent in blue (in the top panels) the full sample of OCs and in orange (in the middle panels) the HQS. The bottom panels shows the running median of the two samples, calculated with a window of 30 points. The shaded area corresponds to 1 MAD from the median (line). Note the change in scale between the top left panel and the two bottom left panels and between the two top right panels and the bottom right panel.
Current usage metrics show cumulative count of Article Views (full-text article views including HTML views, PDF and ePub downloads, according to the available data) and Abstracts Views on Vision4Press platform.
Data correspond to usage on the plateform after 2015. The current usage metrics is available 48-96 hours after online publication and is updated daily on week days.
Initial download of the metrics may take a while.