Fig. 11.
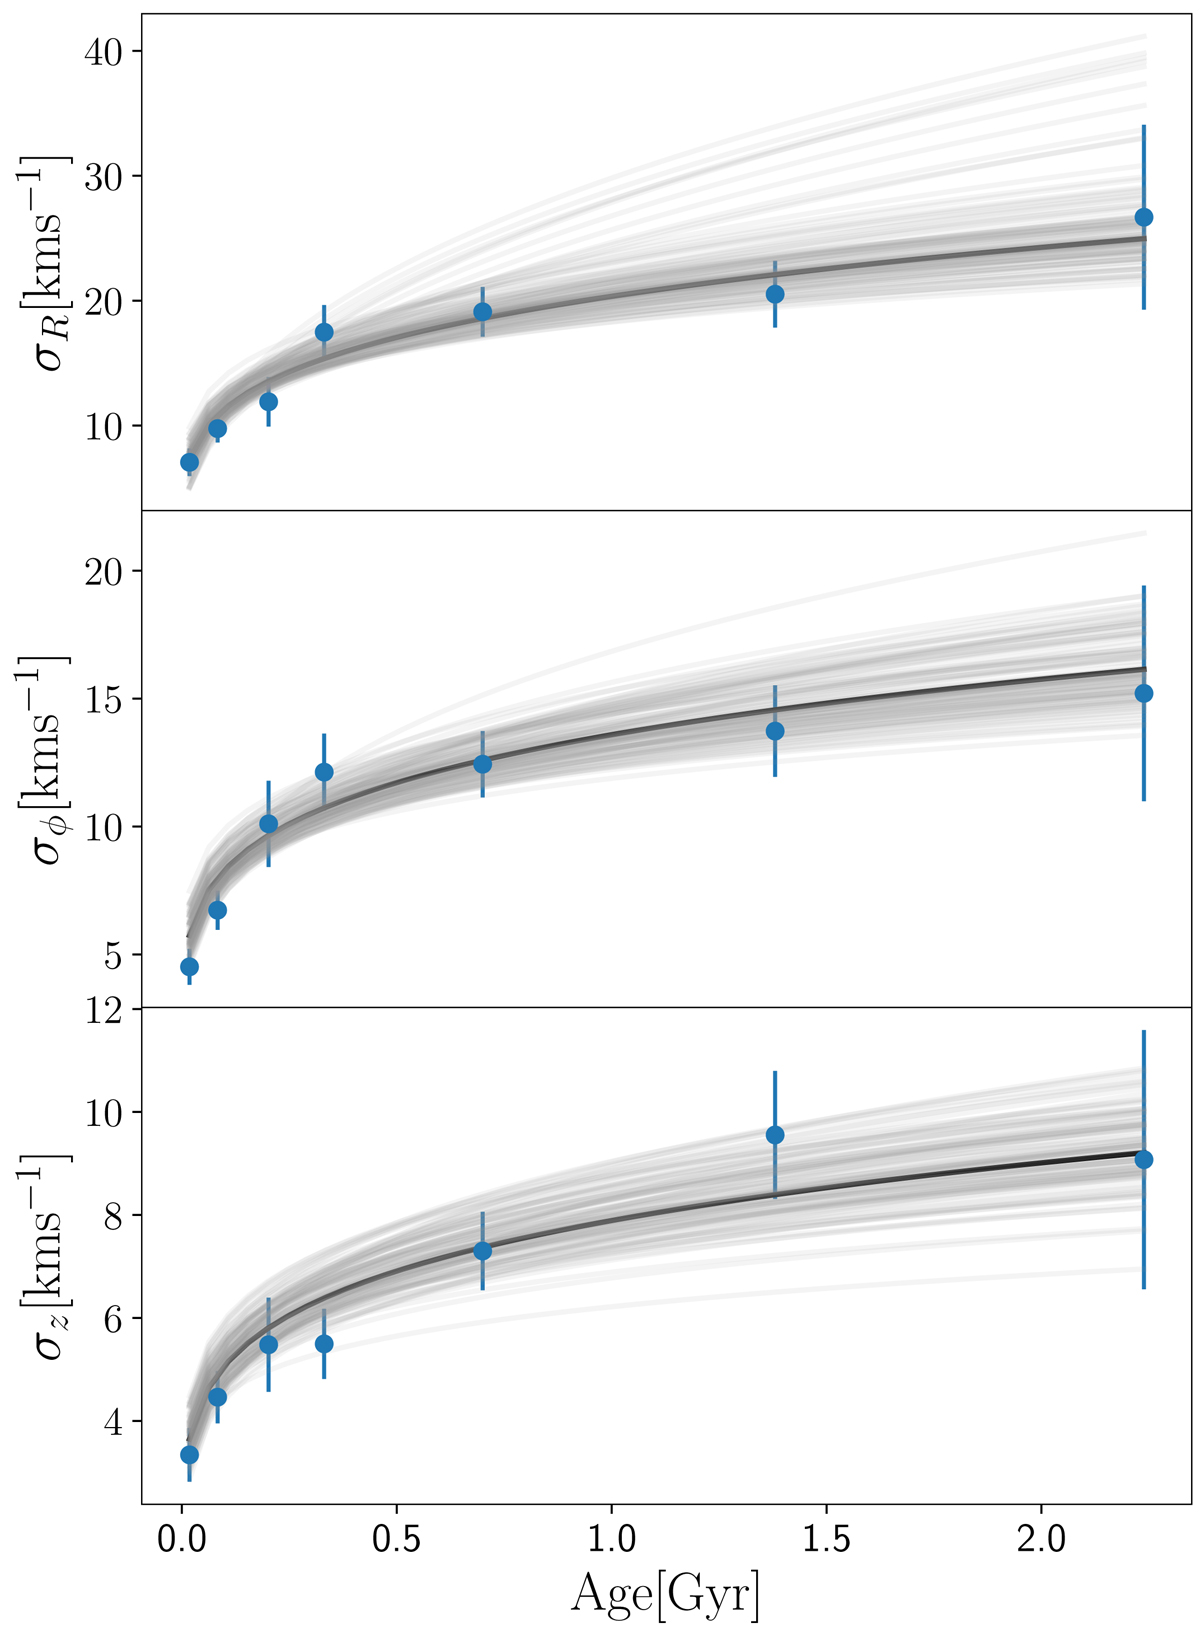
Velocity dispersion of the cylindrical Galactocentric components Vr, Vϕ, and Vz for the HQS. The blue dots and error bars stand for the standard deviations of the velocities and their uncertainties obtained by fitting a Gaussian on each component of the velocities in each of the seven age bins of Table 3, the oldest age bin having an upper limit of 2.5 Gyr. The x value of the blue dots is the median value of the corresponding age bin. The black line shows the best-fit power law obtained using an ML on each cluster of the HQS younger than 2.5 Gyr, and the grey lines represent the uncertainties of the fits.
Current usage metrics show cumulative count of Article Views (full-text article views including HTML views, PDF and ePub downloads, according to the available data) and Abstracts Views on Vision4Press platform.
Data correspond to usage on the plateform after 2015. The current usage metrics is available 48-96 hours after online publication and is updated daily on week days.
Initial download of the metrics may take a while.