Fig. 4
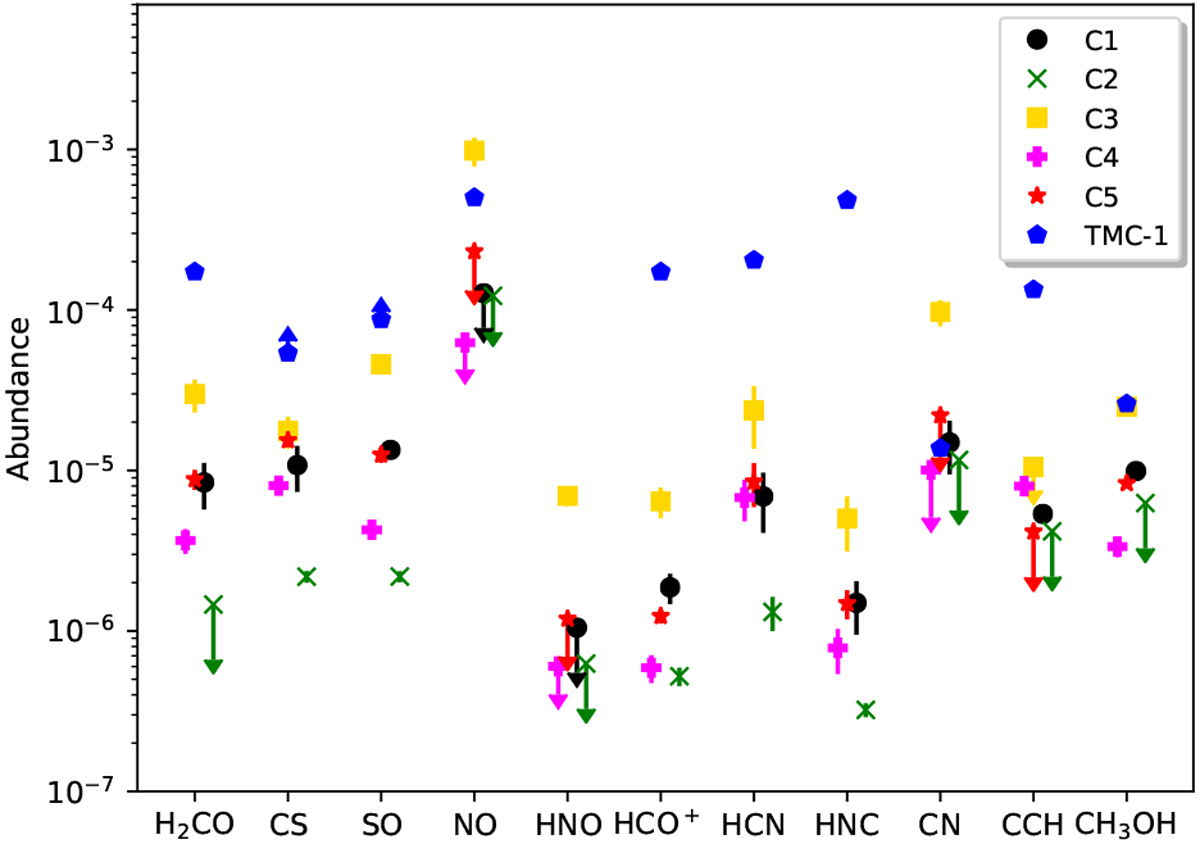
Species abundances (of the molecules listed in Table A.1) with respect to CO in each of the clouds. Arrows represent upper or lower limits. Vertical lines represent error bars computed from the variation of species column densities due to the uncertainty in the physical conditions. Blue points are the values reported in the literature towards the cold core TMC-1 (CP).
Current usage metrics show cumulative count of Article Views (full-text article views including HTML views, PDF and ePub downloads, according to the available data) and Abstracts Views on Vision4Press platform.
Data correspond to usage on the plateform after 2015. The current usage metrics is available 48-96 hours after online publication and is updated daily on week days.
Initial download of the metrics may take a while.