Fig. 8.
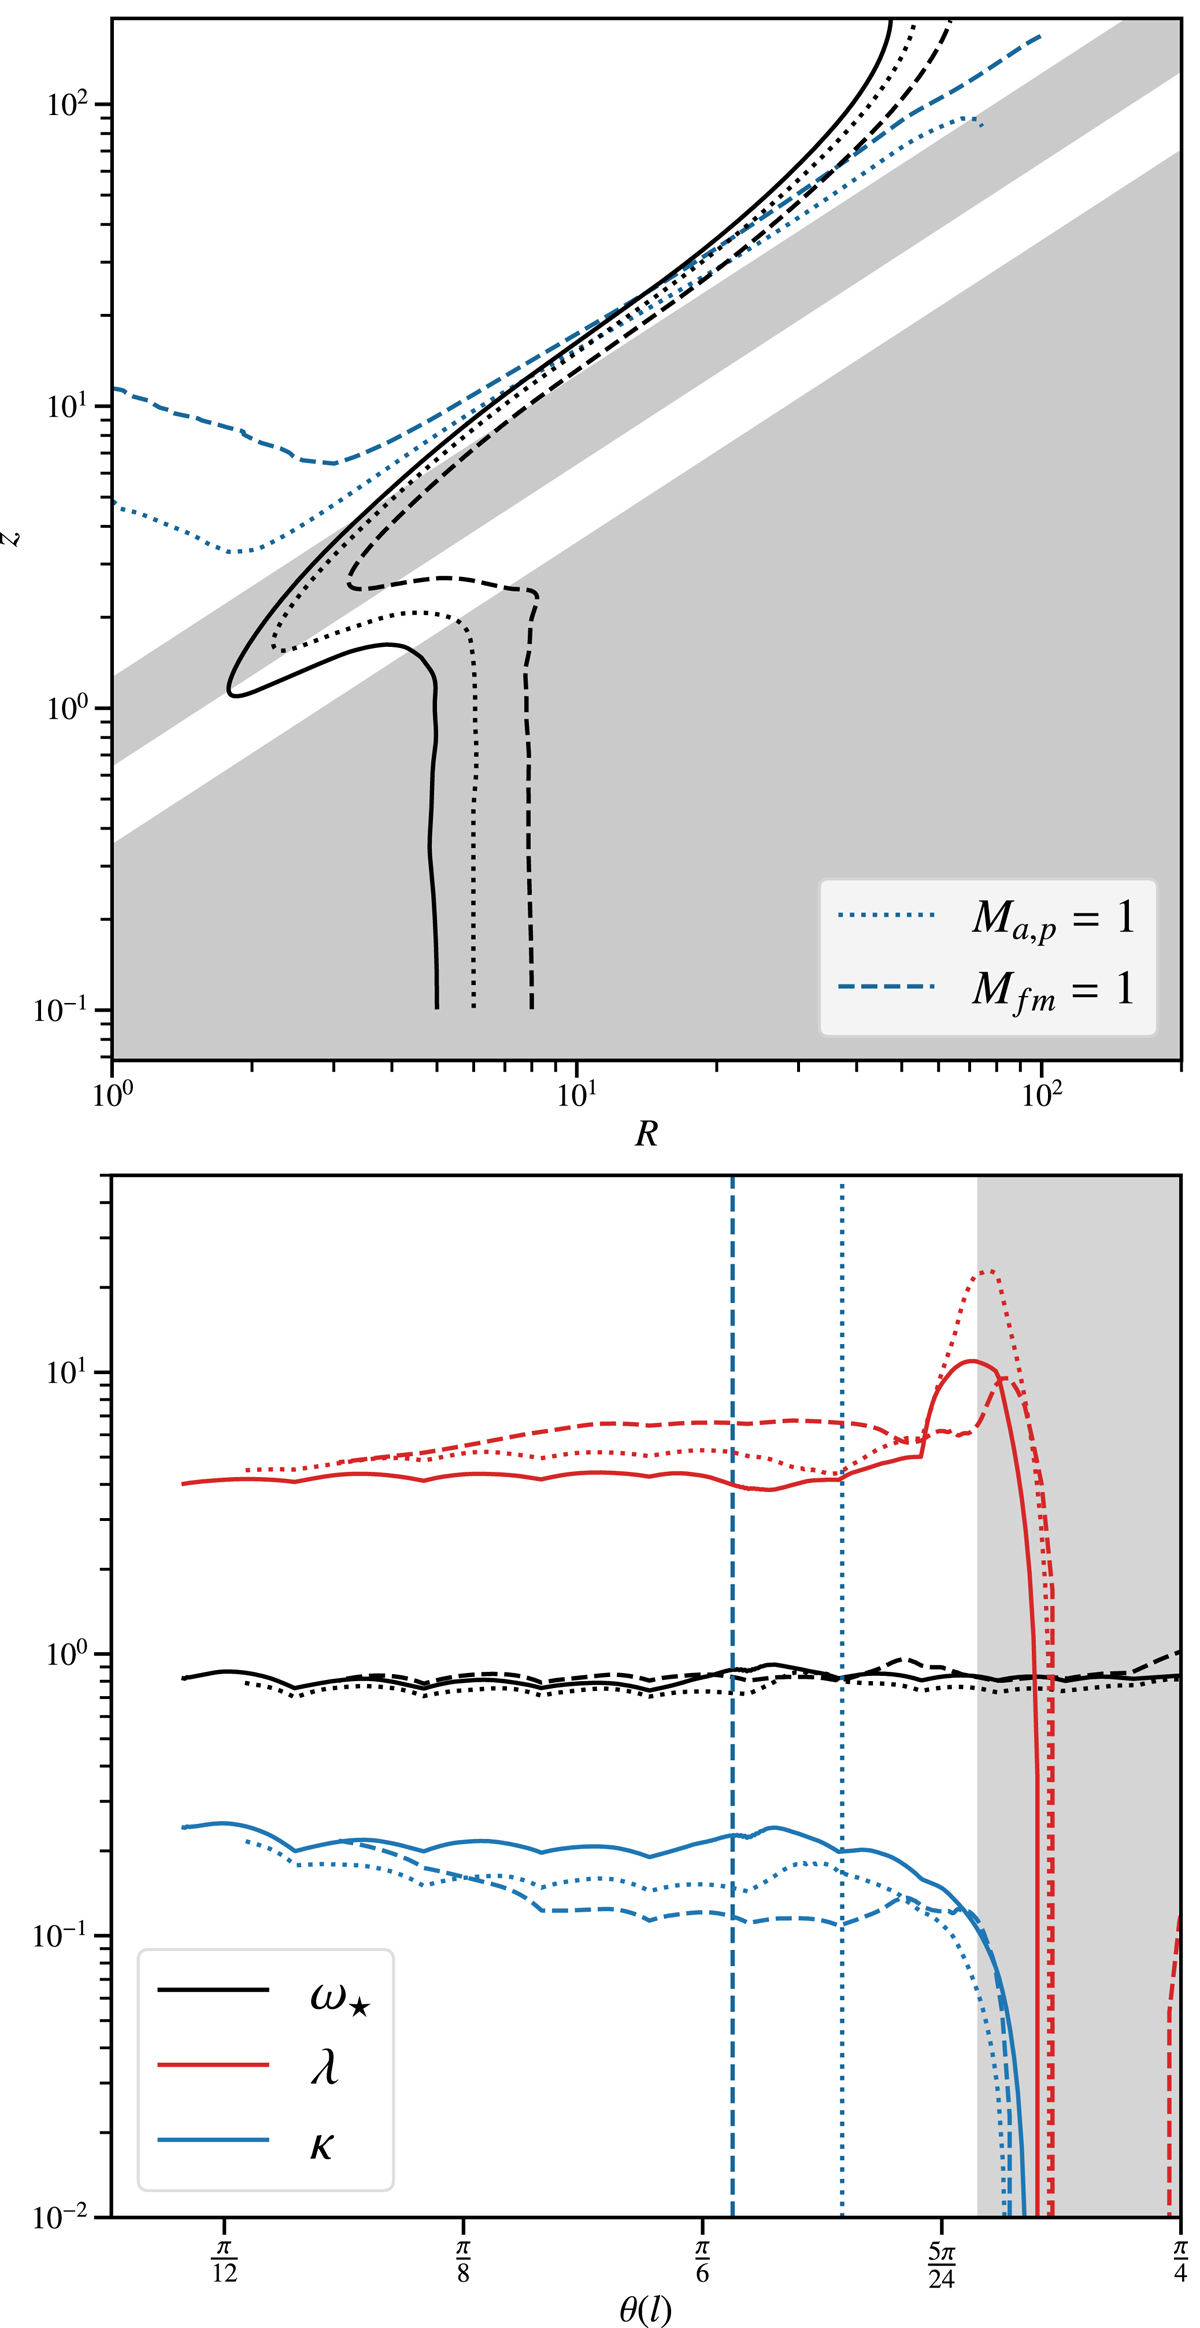
Top: mean poloidal magnetic field lines in the (R,z) plane. The blue lines define the different critical surfaces (see Sect. 3.1) and they are represented as vertical lines in the lower panel. The grey zones determine the turbulent zones defined in Sect. 3.1. The lower zone corresponds to the disk and the upper zone corresponds to the turbulent atmosphere. Bottom: MHD invariants calculated along the field lines of the upper panel as functions of the latitudinal coordinate. The line style of the MHD invariants has a one to one correspondence with the field line where the invariant was calculated. The grey zone corresponds to the end of the turbulent atmosphere.
Current usage metrics show cumulative count of Article Views (full-text article views including HTML views, PDF and ePub downloads, according to the available data) and Abstracts Views on Vision4Press platform.
Data correspond to usage on the plateform after 2015. The current usage metrics is available 48-96 hours after online publication and is updated daily on week days.
Initial download of the metrics may take a while.