Fig. 4.
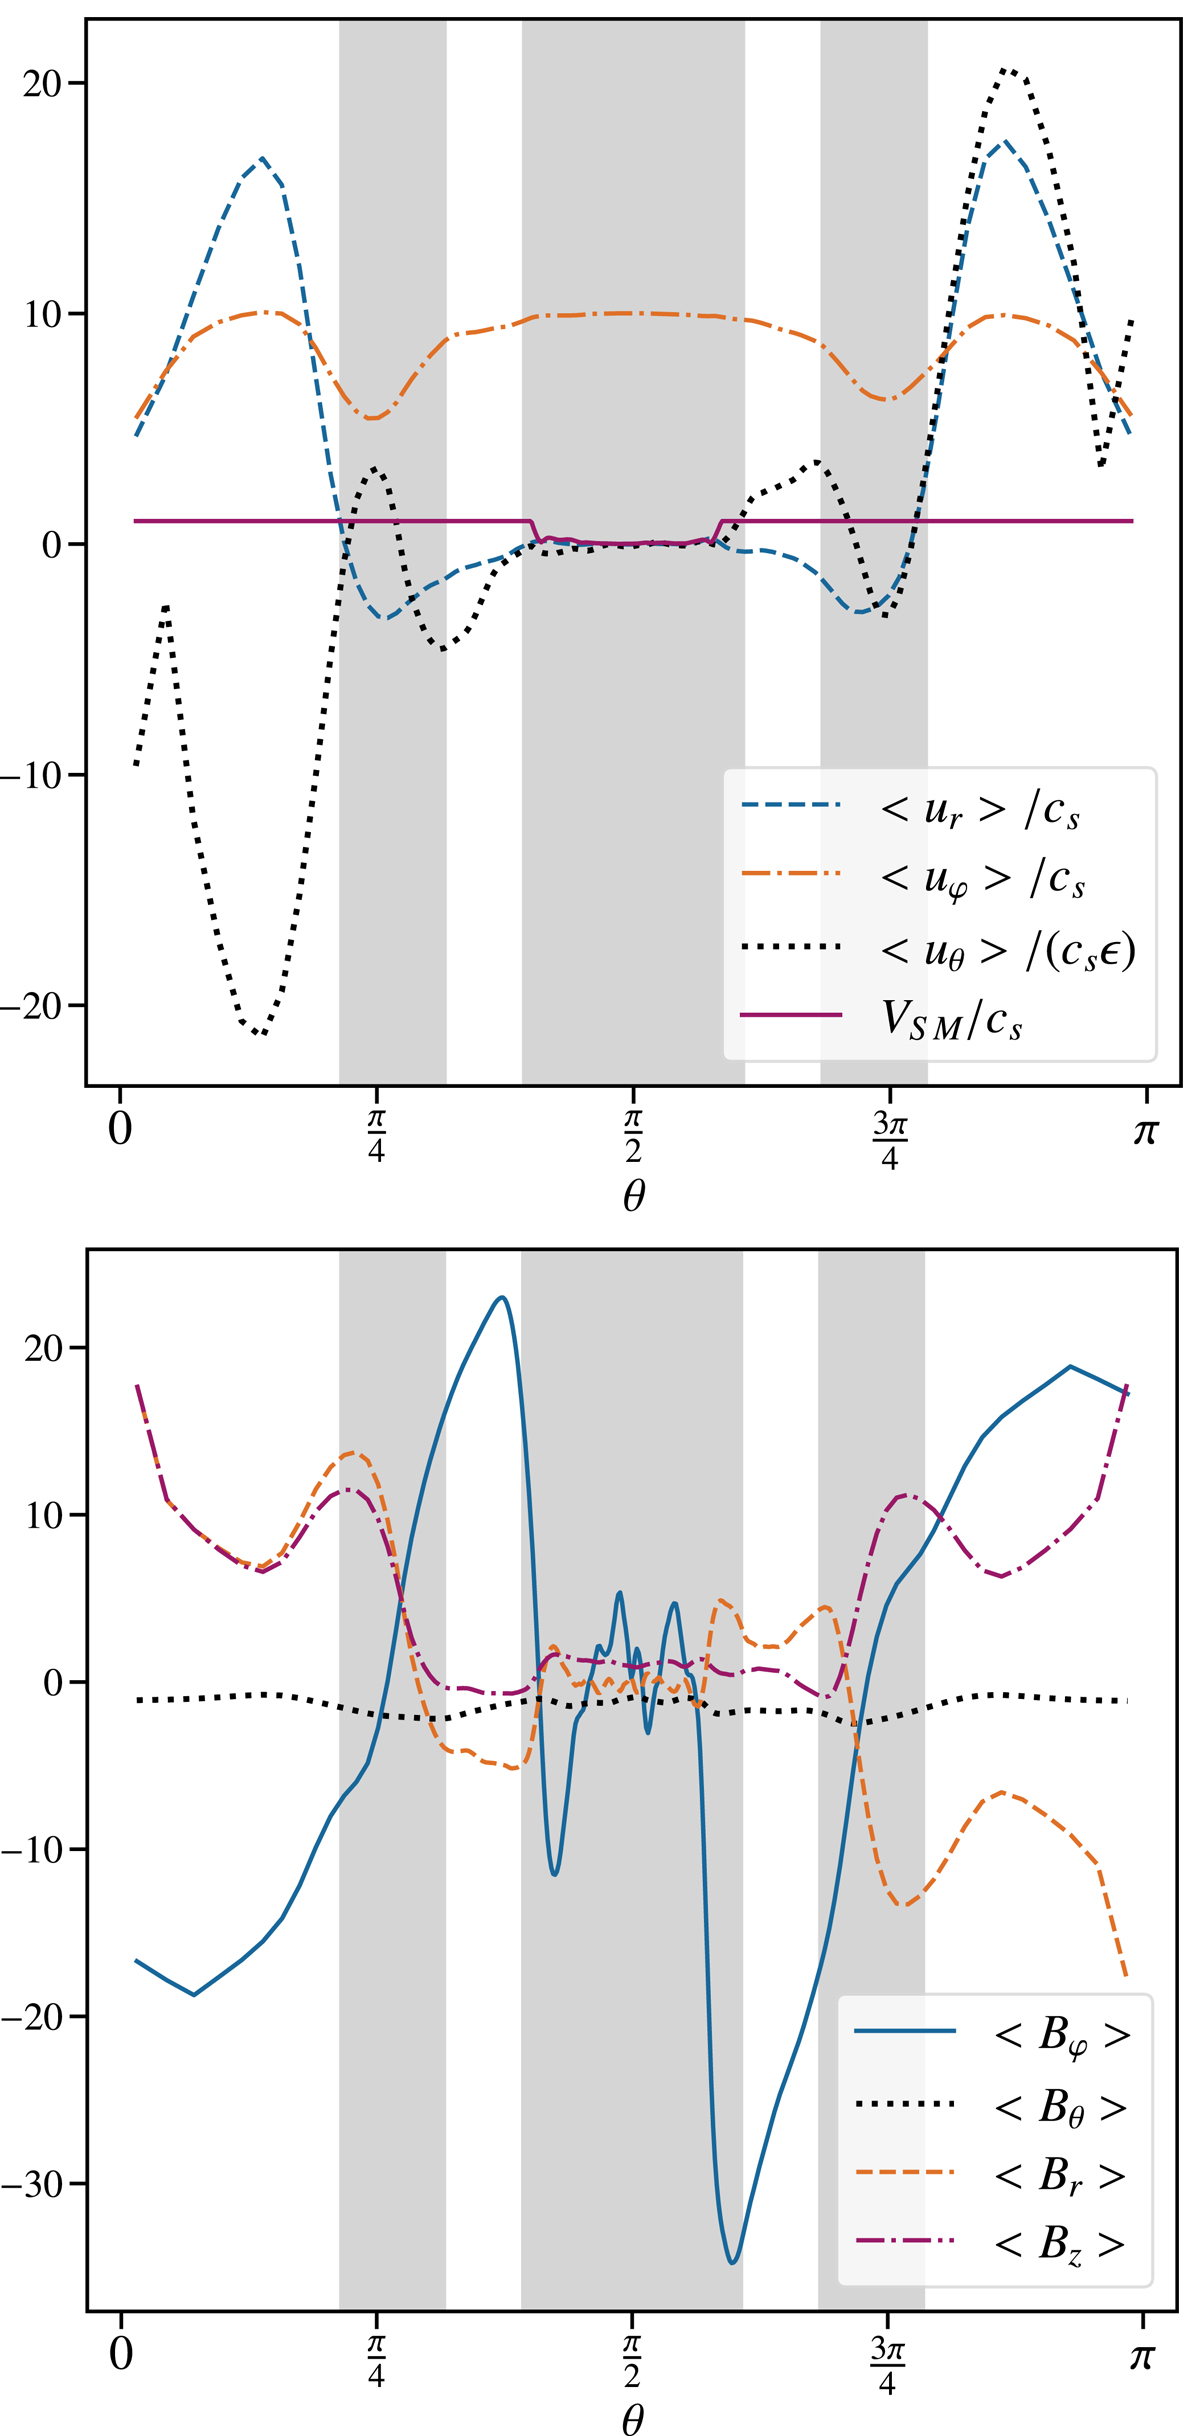
Top: velocity profiles as functions of the latitudinal coordinate, θ, normalised to the local sound speed. Bottom: mean magnetic field profiles normalised to the vertical magnetic field in the disk mid-plane, ⟨Bz⟩(r, θ = π/2) as functions of the latitudinal coordinate. The grey zones correspond to the turbulent regions in Fig. 3. All profiles are radially averaged between r1 = 8 and r2 = 14 after being normalised.
Current usage metrics show cumulative count of Article Views (full-text article views including HTML views, PDF and ePub downloads, according to the available data) and Abstracts Views on Vision4Press platform.
Data correspond to usage on the plateform after 2015. The current usage metrics is available 48-96 hours after online publication and is updated daily on week days.
Initial download of the metrics may take a while.