Fig. 3.
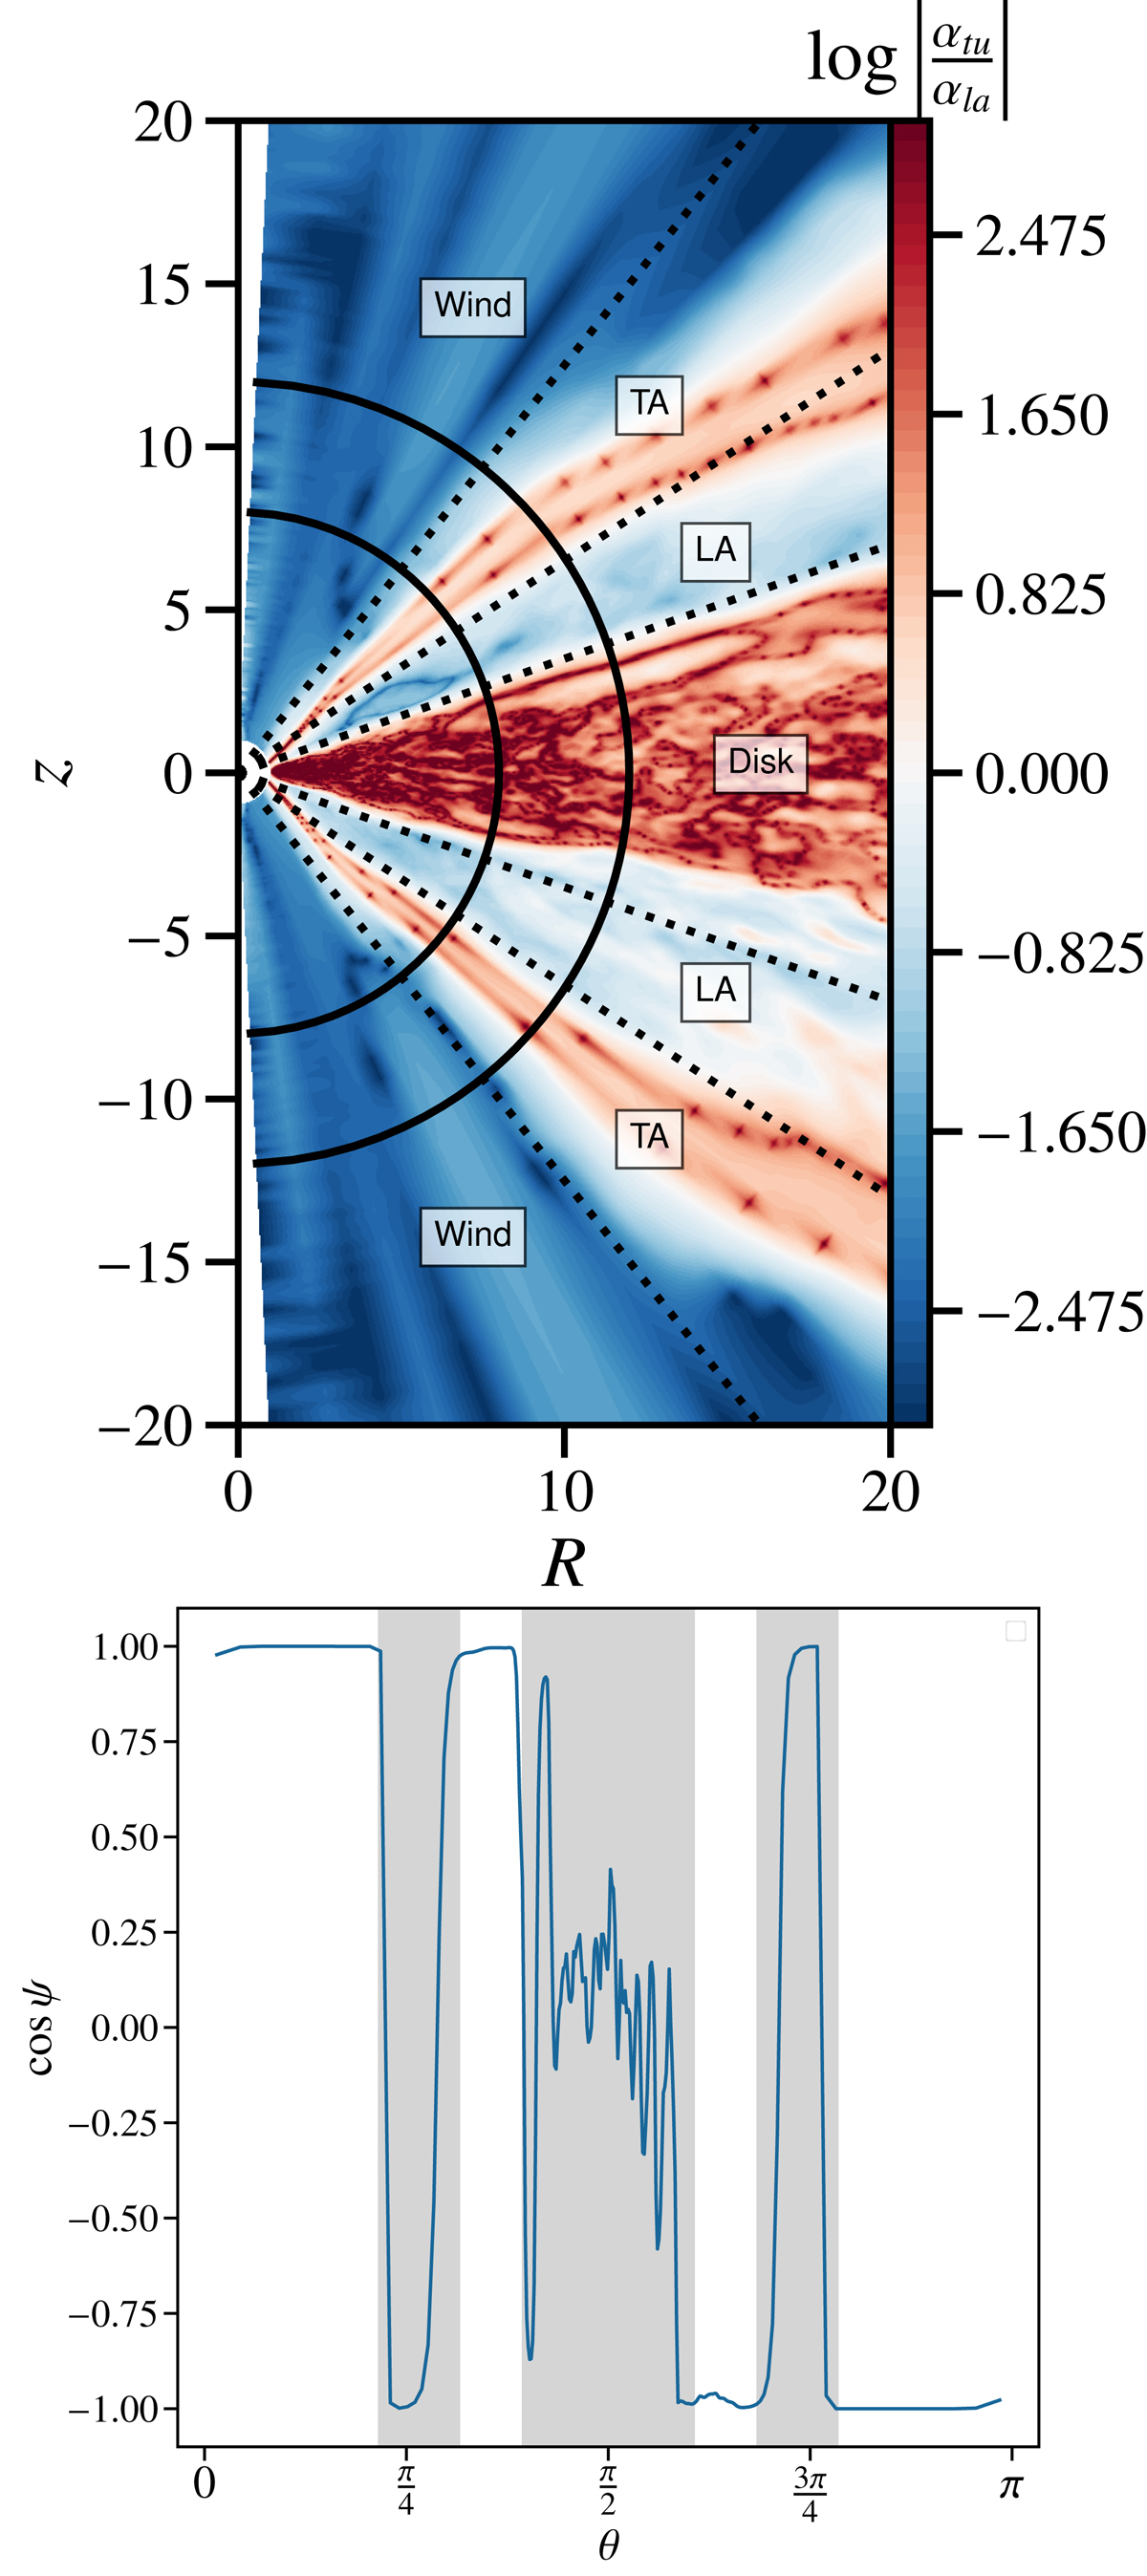
Top: ratio αla/αtu denoting turbulent (red) and laminar (blue) regions. The dotted lines delimit these regions and represent |z| = 3.5h, |z| = 6.5h and |z| = 12.5h. The two different circles denote the radii used for the calculation of the fluxes (r1 = 8, r2 = 14), see Sects. 3.2.1 and Appendix B. TA and LA correspond for turbulent and laminar atmosphere, respectively. Bottom: cosine of the angle ψ between the mean poloidal velocity and the mean poloidal magnetic field as a function of the latitudinal coordinate. The grey zones correspond to the turbulent regions in the top panel, delimited by the dotted lines.
Current usage metrics show cumulative count of Article Views (full-text article views including HTML views, PDF and ePub downloads, according to the available data) and Abstracts Views on Vision4Press platform.
Data correspond to usage on the plateform after 2015. The current usage metrics is available 48-96 hours after online publication and is updated daily on week days.
Initial download of the metrics may take a while.