Fig. B.3.
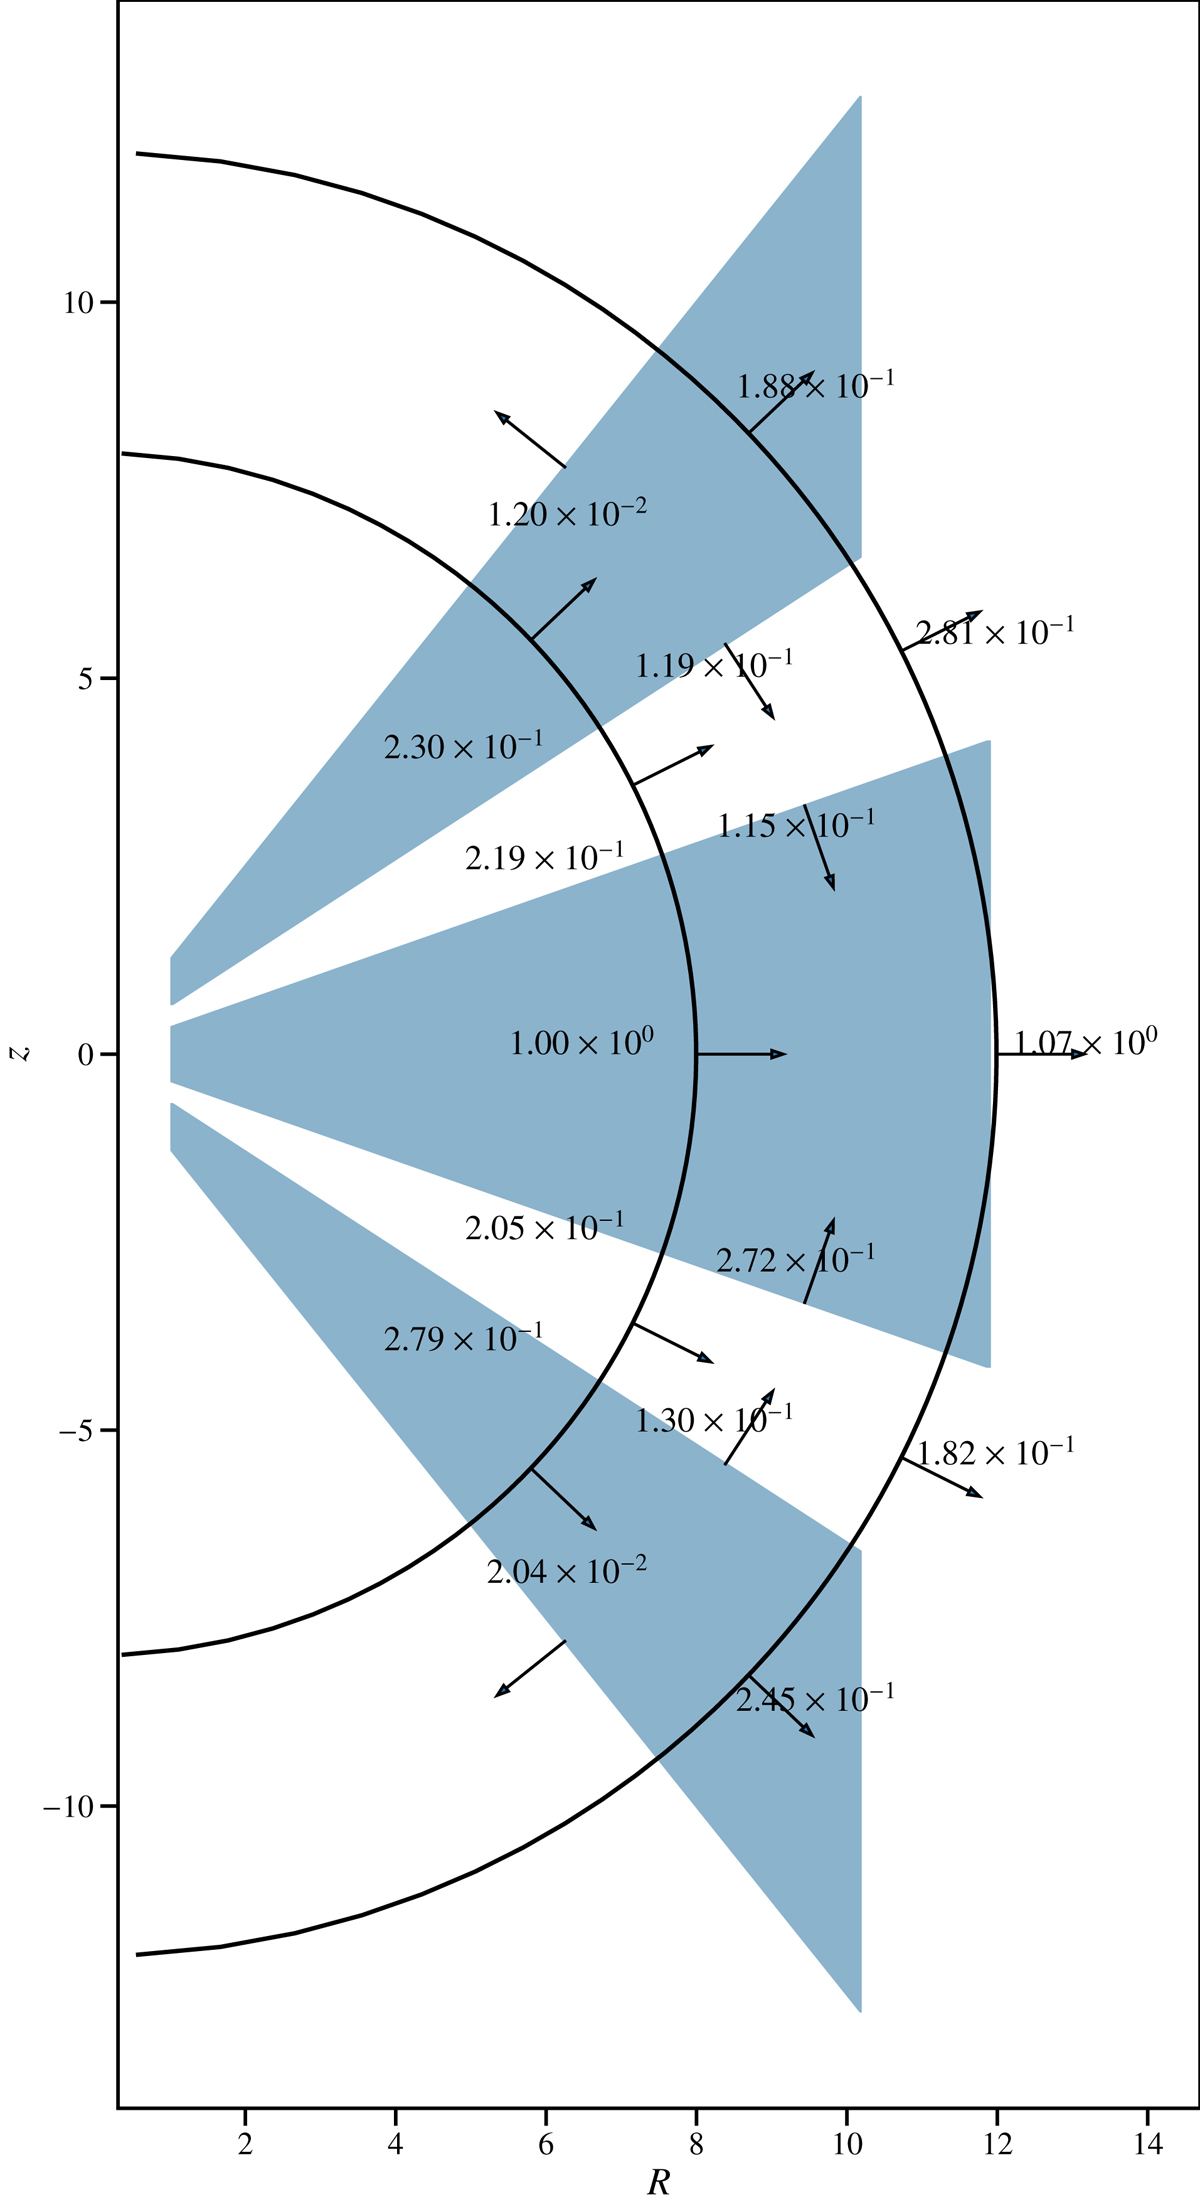
Angular momentum fluxes accross the whole domain, the regions shaded blue are turbulent regions. The different fluxes are defined in Appendix B and they are integrated between t1 and t2. The arrows represent the direction of the fluxes. In this figure we are only representing the fluxes that emerge from the Reynolds and magnetic stresses FL, r2, FL, r1, FL, θ1, FL, θ2 not the flux of angular momentum though accretion. However, the sum of these fluxes (taking in to account their direction) leads to the value of the angular momentum being transported by the accretion.
Current usage metrics show cumulative count of Article Views (full-text article views including HTML views, PDF and ePub downloads, according to the available data) and Abstracts Views on Vision4Press platform.
Data correspond to usage on the plateform after 2015. The current usage metrics is available 48-96 hours after online publication and is updated daily on week days.
Initial download of the metrics may take a while.