Fig. B.2.
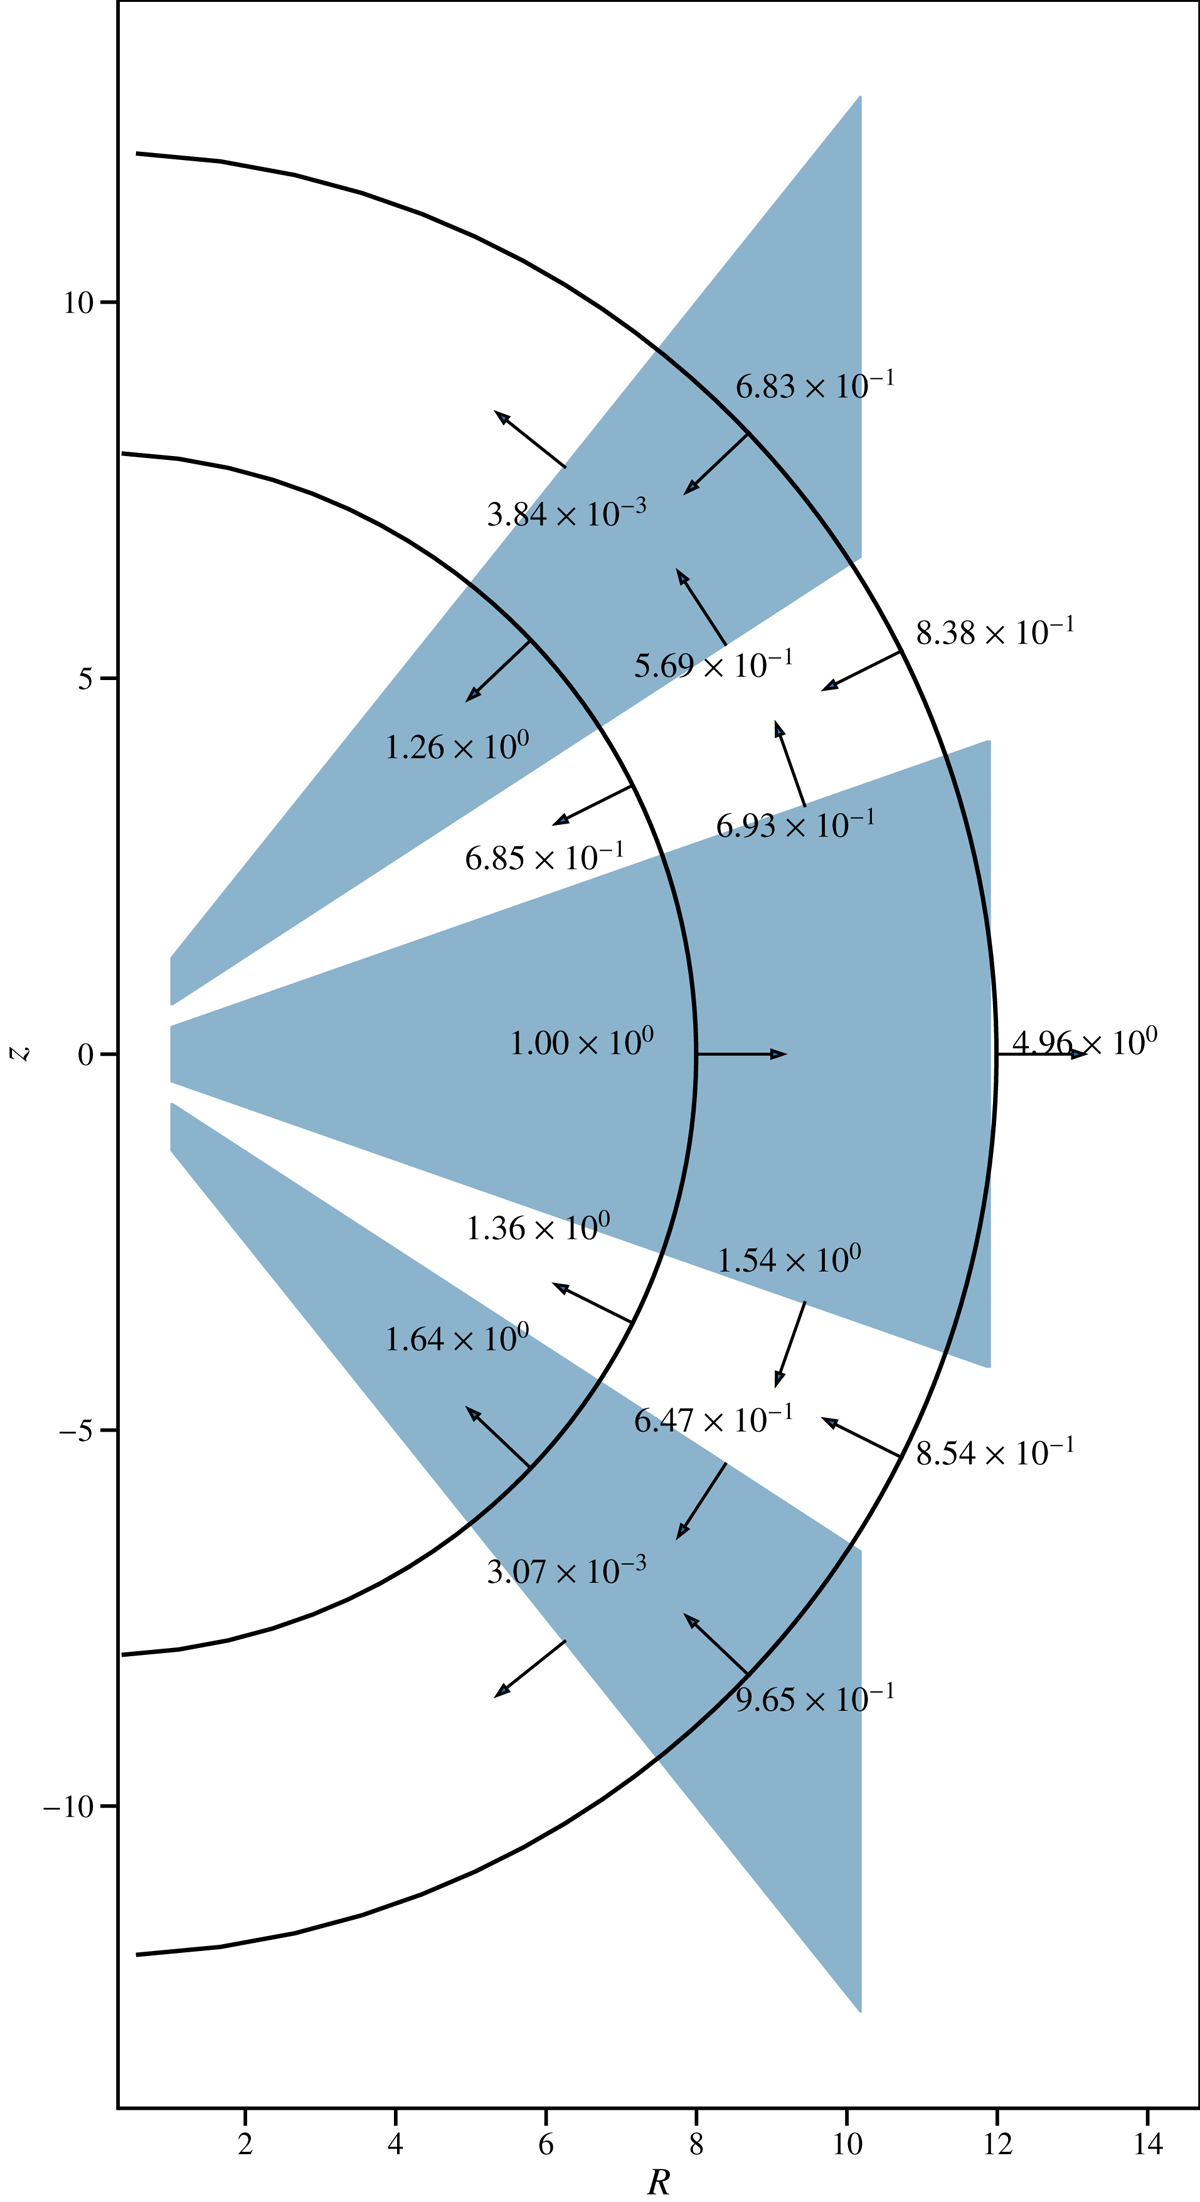
Mass fluxes inside of the whole domain, the regions shaded blue are turbulent regions. The different fluxes are defined in Appendix B. The arrows represent the direction of the fluxes. Since we are representing the different mass fluxes of a region of the disk, their sum (taking into account their direction) should be equal to the mass difference between t1 and t2.
Current usage metrics show cumulative count of Article Views (full-text article views including HTML views, PDF and ePub downloads, according to the available data) and Abstracts Views on Vision4Press platform.
Data correspond to usage on the plateform after 2015. The current usage metrics is available 48-96 hours after online publication and is updated daily on week days.
Initial download of the metrics may take a while.