Fig. 2.
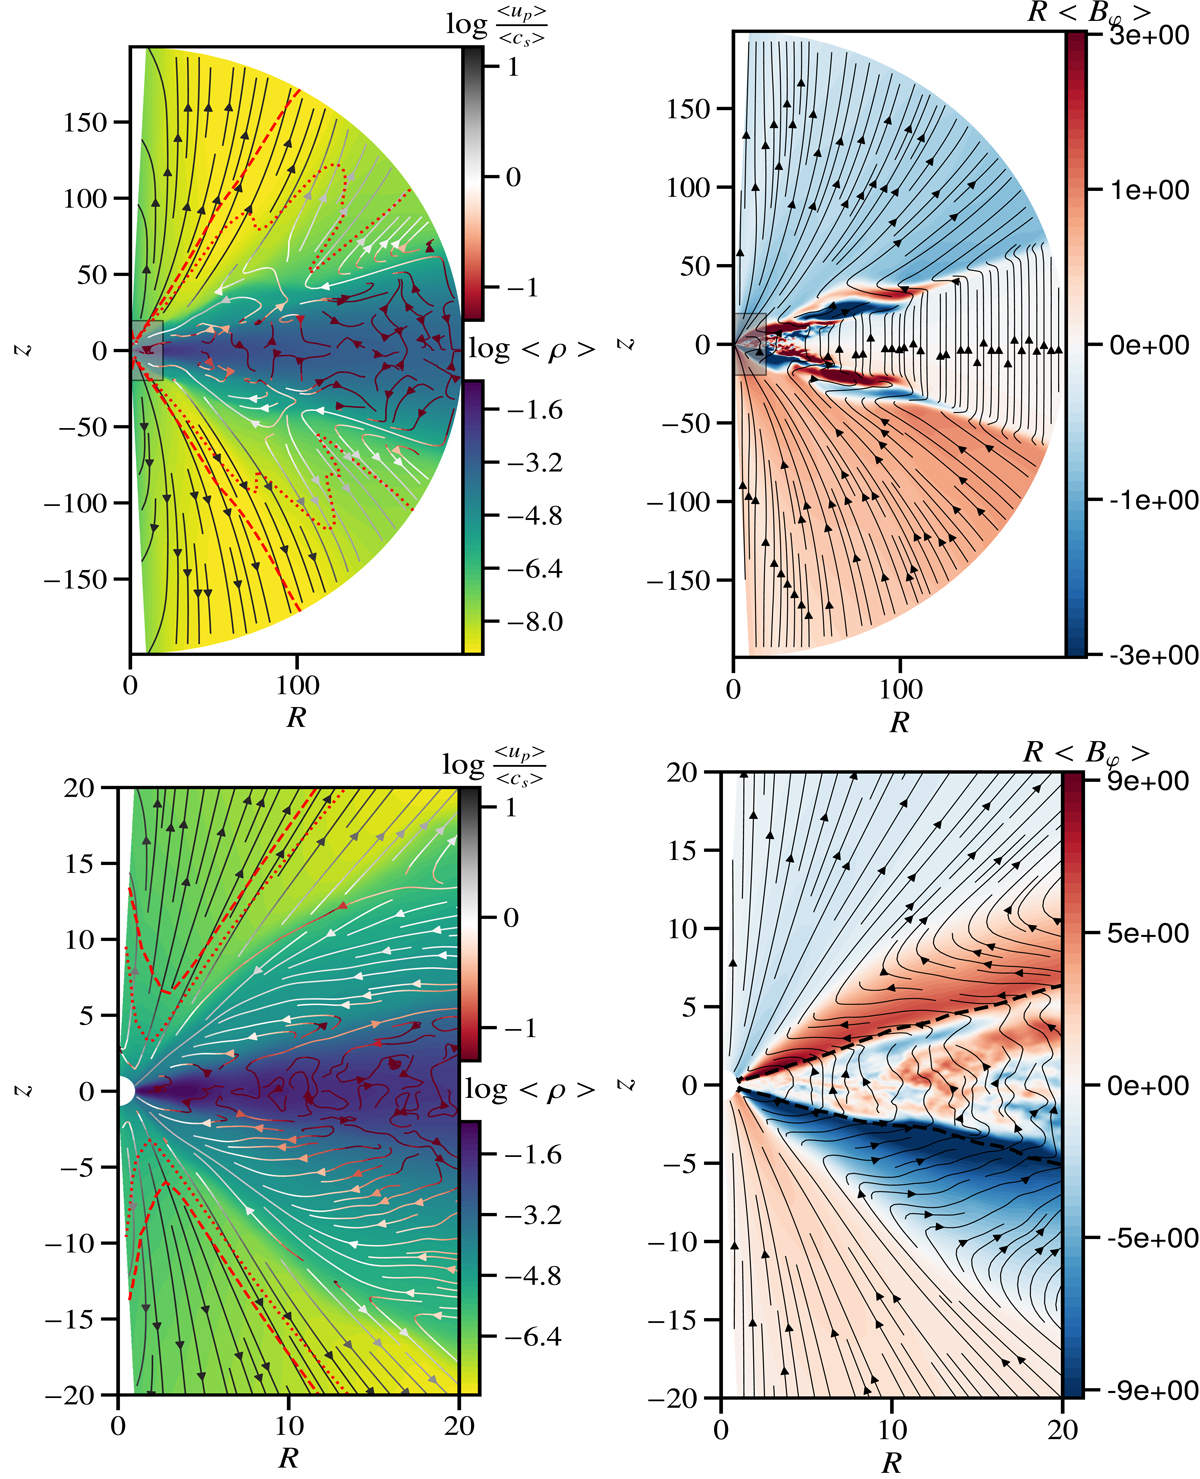
Top, left: gas density and mean poloidal stream lines. The red dotted line corresponds to the Alfvénic surface, and the red dashed line corresponds to the fast magneto-sonic surface. The colour of the poloidal stream lines correspond to the logarithm of their magnitude normalised to the sound speed. Top, right: RBφ normalised to BiRin; and mean poloidal field lines. The grey square corresponds to the zoomed in region the bottom figure. Bottom: same as top but zoomed in the greyed region. The black dashed line indicates the surface where ⟨β⟩ = 8π⟨P⟩/⟨B⟩2 = 1.
Current usage metrics show cumulative count of Article Views (full-text article views including HTML views, PDF and ePub downloads, according to the available data) and Abstracts Views on Vision4Press platform.
Data correspond to usage on the plateform after 2015. The current usage metrics is available 48-96 hours after online publication and is updated daily on week days.
Initial download of the metrics may take a while.