Fig. 18.
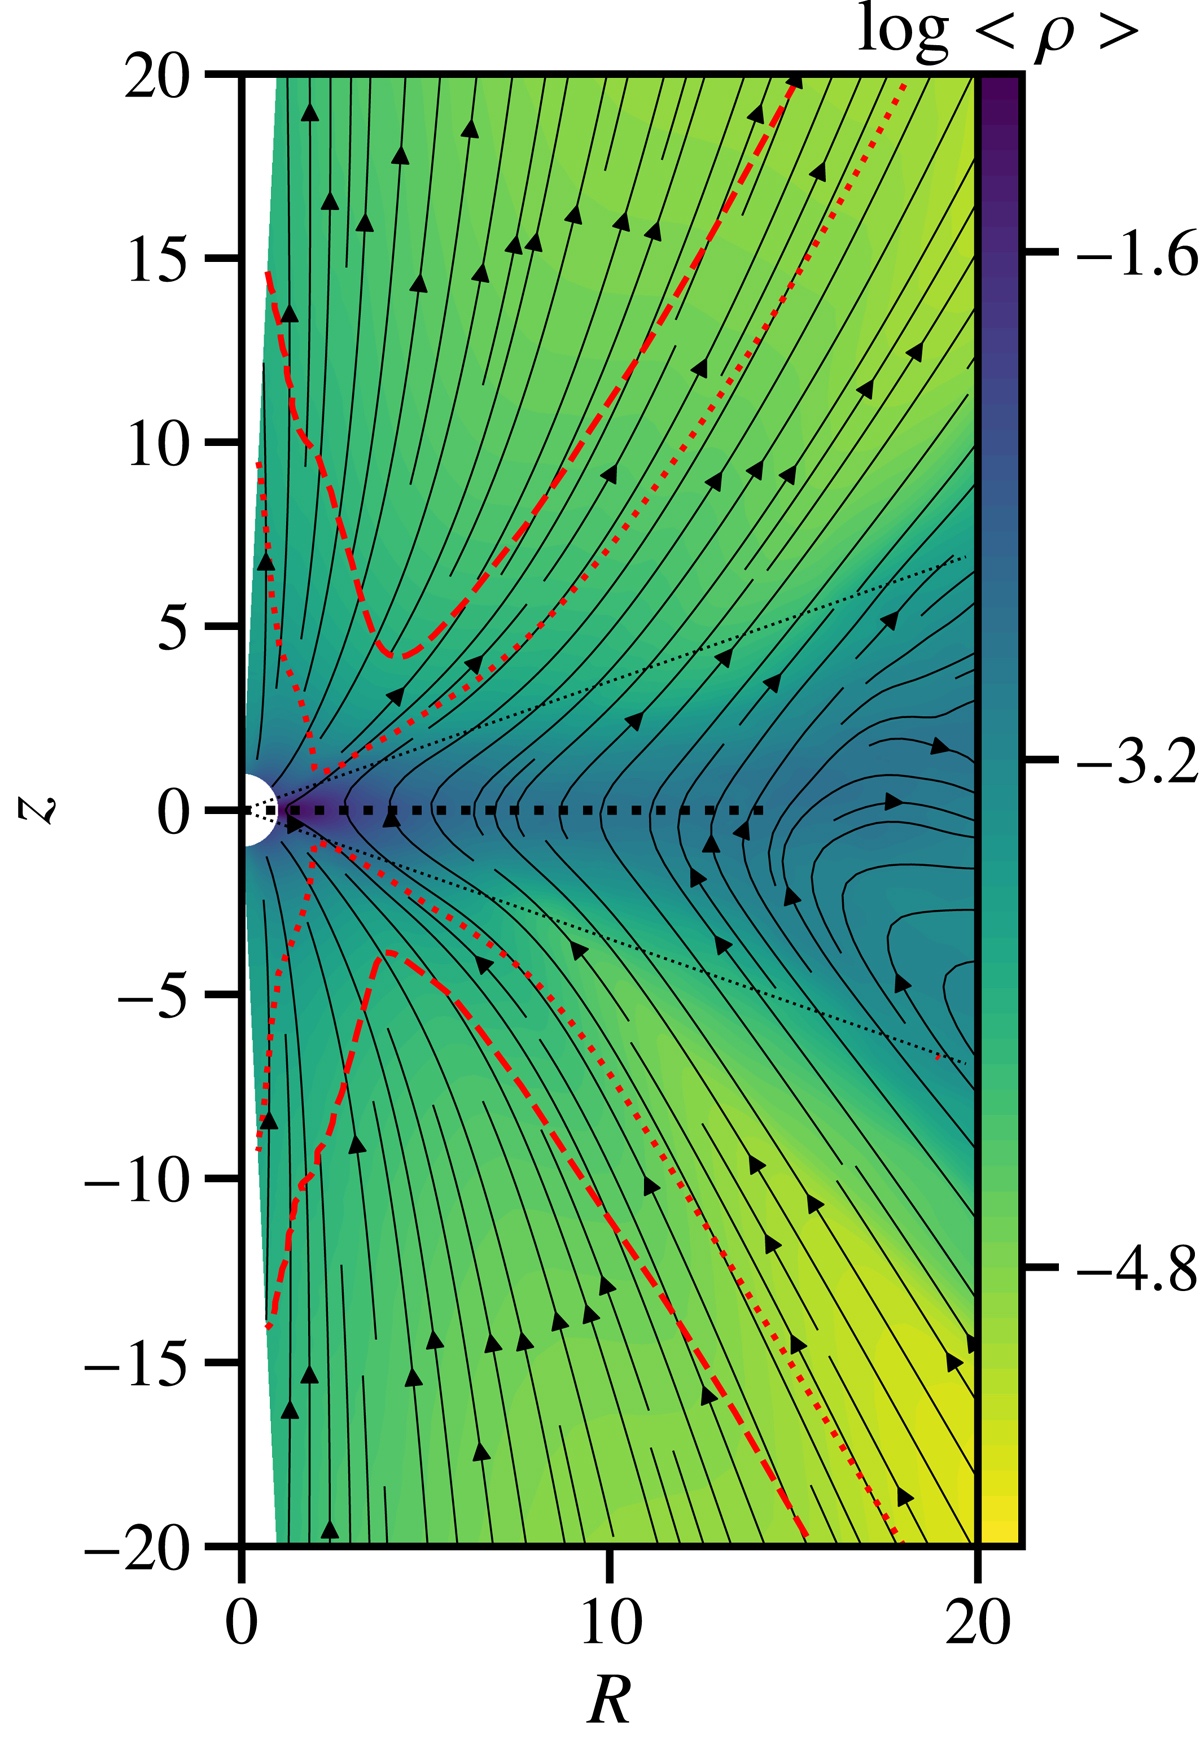
Appearance of the SB2 strong field simulation: logarithm of the density (background colour), mean poloidal magnetic field lines (black solid lines), Alfvén (red dotted line) and fast magneto-sonic (red dashed line) critical surfaces. The black dotted lines represent the end of the disk region defined in Fig. 14. The quantities are averaged between t1 = 1719Tin and t2 = 1910Tin with a resolution of Δt = 0.16Tin.
Current usage metrics show cumulative count of Article Views (full-text article views including HTML views, PDF and ePub downloads, according to the available data) and Abstracts Views on Vision4Press platform.
Data correspond to usage on the plateform after 2015. The current usage metrics is available 48-96 hours after online publication and is updated daily on week days.
Initial download of the metrics may take a while.