Fig. 10.
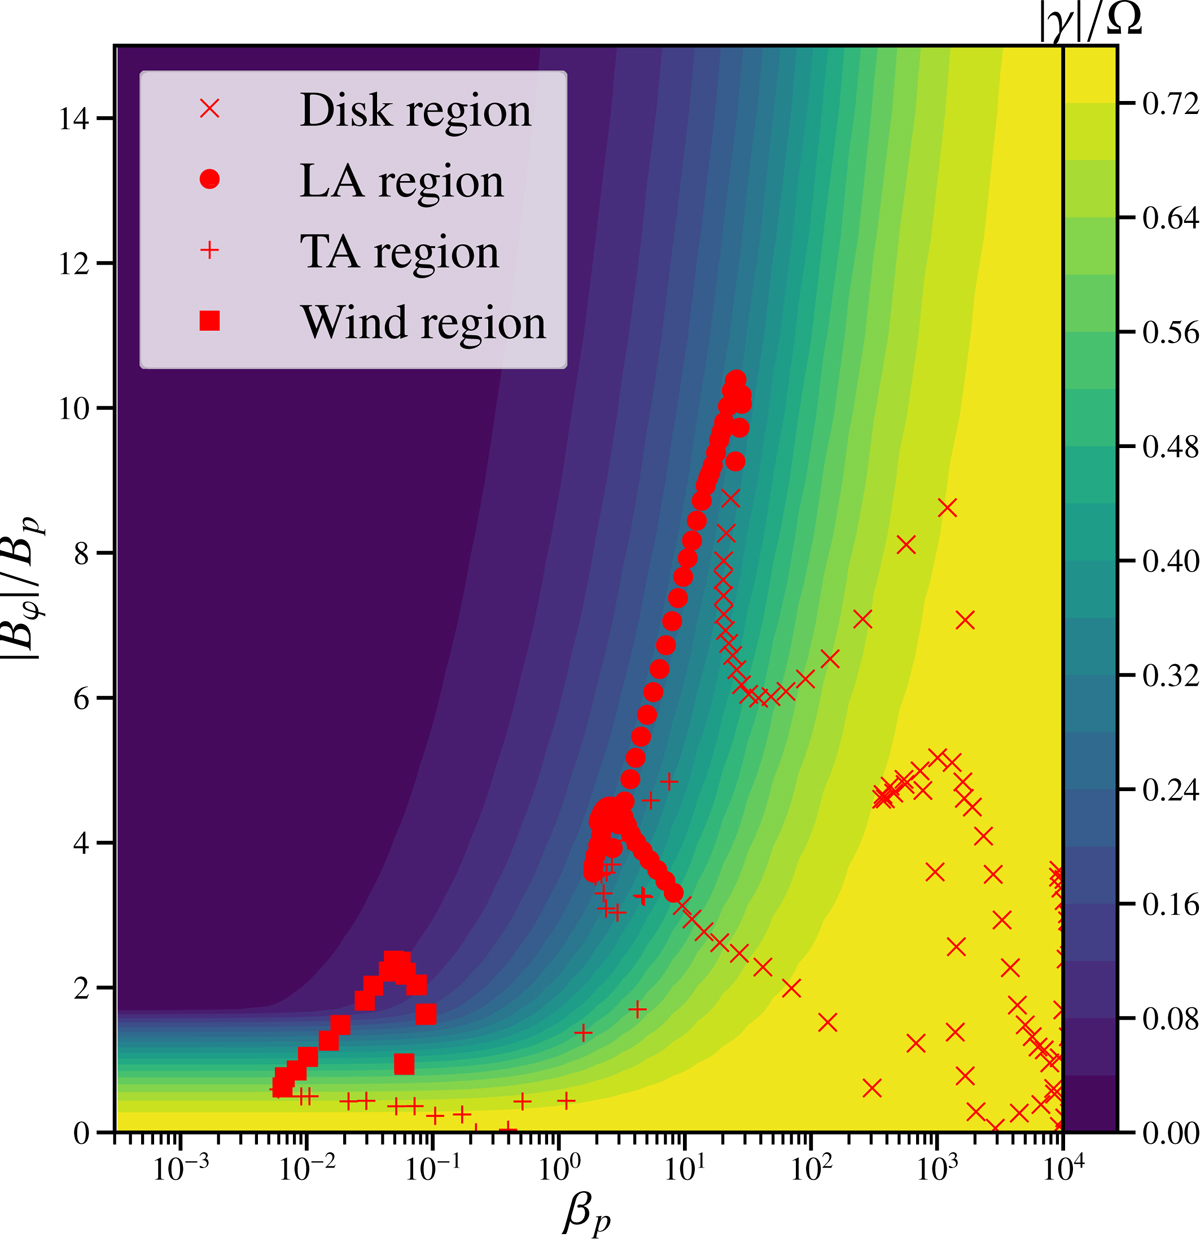
Maximum growth rate of the compressible MRI as a function of the poloidal plasma beta and the ratio between the toroidal and poloidal magnetic field, calculated using Eq. (C.2). The red points correspond to the values of the ratio of the magnetic field and the poloidal plasma beta for different regions within our simulation averaged between r1 = 8 and r2 = 12 (see Fig. 4). We find that laminar regions are characterised by reduced MRI growth rates (≲0.25ΩK).
Current usage metrics show cumulative count of Article Views (full-text article views including HTML views, PDF and ePub downloads, according to the available data) and Abstracts Views on Vision4Press platform.
Data correspond to usage on the plateform after 2015. The current usage metrics is available 48-96 hours after online publication and is updated daily on week days.
Initial download of the metrics may take a while.