Fig. 9.
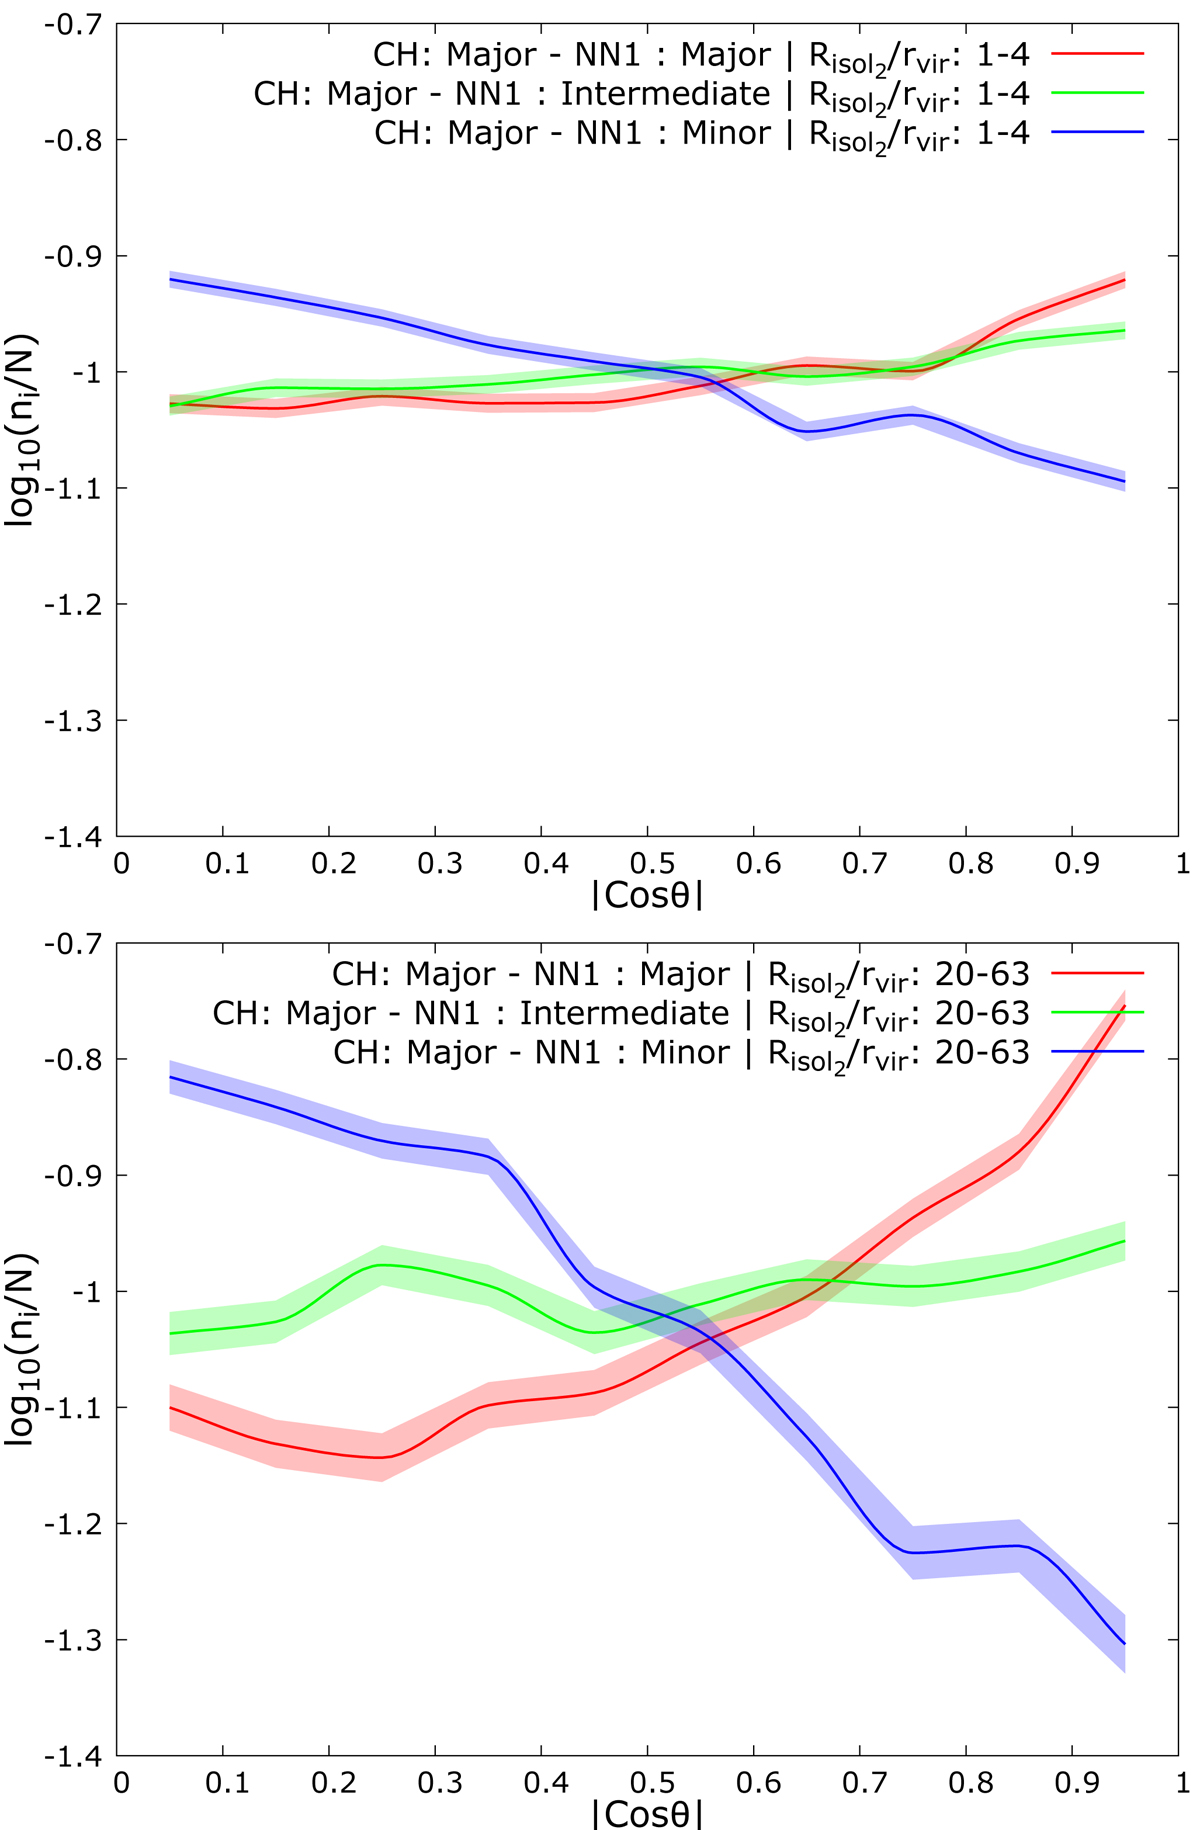
Frequency distribution of |cos(θ)|, where θ is the angle between the major axis of the CH and the major (red), intermediate (green), and minor (blue) axis of its first nearest neighbor (NN1). Only close halo pair (i.e., CHs separated from their NN1 by 1 < Risol/rvir < 4 are considered for this figure. Upper panel: close halo pairs where the CHs are separated from their NN2 by 1 < Risol2/rvir < 4. Lower panel: close halo pairs where the CHs are separated from their NN2 by 20 < Risol2/rvir < 63.
Current usage metrics show cumulative count of Article Views (full-text article views including HTML views, PDF and ePub downloads, according to the available data) and Abstracts Views on Vision4Press platform.
Data correspond to usage on the plateform after 2015. The current usage metrics is available 48-96 hours after online publication and is updated daily on week days.
Initial download of the metrics may take a while.