Fig. 11.
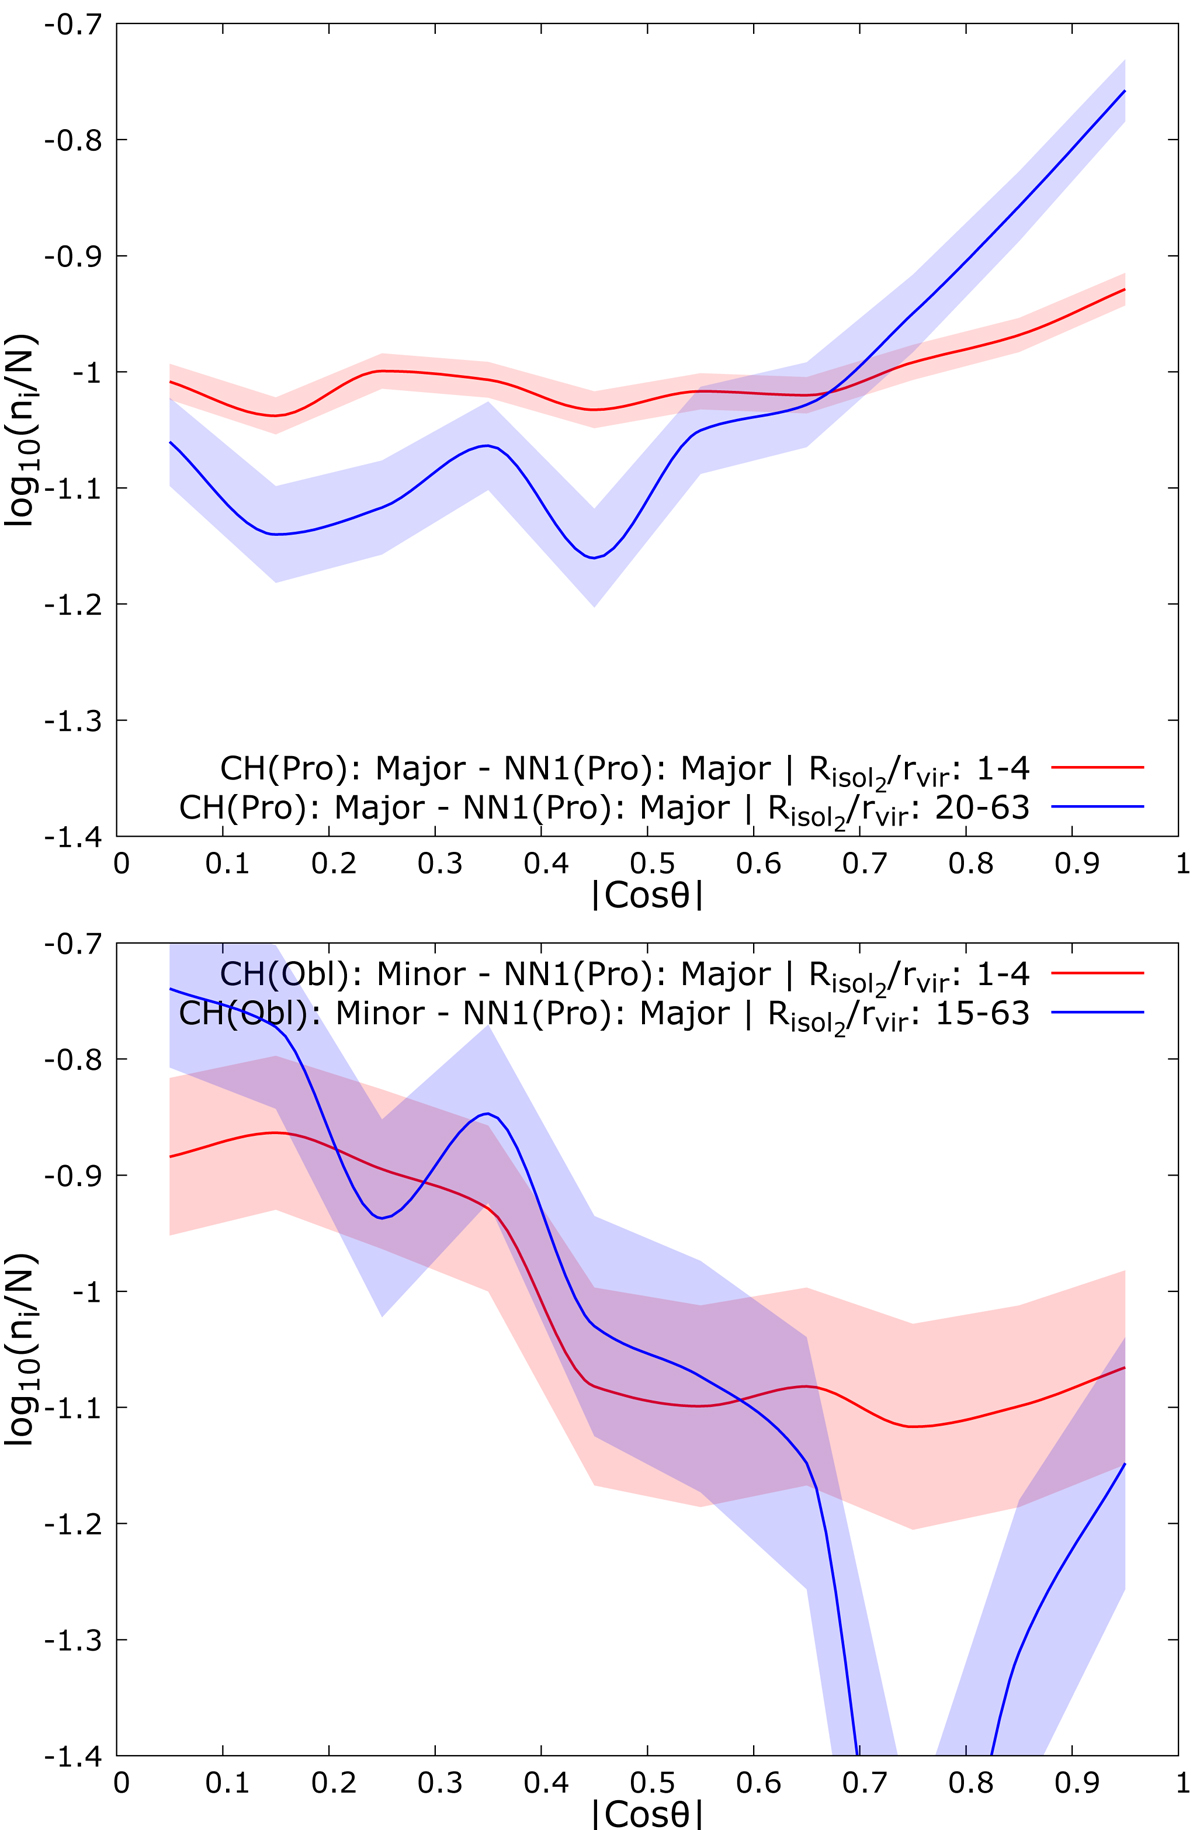
Comparison of the shape alignment between the close halo pairs (i.e., CHs separated from their NN1 by 1 < Risol/rvir < 4) of two distinct halo populations, based on their shape, for two extreme environments. Upper panel (Population A): frequency distribution of |cos(θ)|, where θ is the angle between the major axis of the prolate CH and the major axis of its prolate first nearest neighbor (NN1) for two different isolation bins: close halo pairs where the CHs are separated from their NN2 by 1 < Risol2/rvir < 4 and close halo pairs where the CHs are separated from their NN2 by 20 < Risol2/rvir < 63. Lower panel (Population B): frequency distribution of |cos(θ)|, where θ is the angle between the minor axis of the Oblate CH and the major axis of its prolate first nearest neighbor (NN1) for two different isolation bins: close halo pairs where the CHs are separated from their NN2 by 1 < Risol2/rvir < 4 and close halo pairs where the CHs are separated from their NN2 by 15 < Risol2/rvir < 63.
Current usage metrics show cumulative count of Article Views (full-text article views including HTML views, PDF and ePub downloads, according to the available data) and Abstracts Views on Vision4Press platform.
Data correspond to usage on the plateform after 2015. The current usage metrics is available 48-96 hours after online publication and is updated daily on week days.
Initial download of the metrics may take a while.