Open Access
Fig. 8
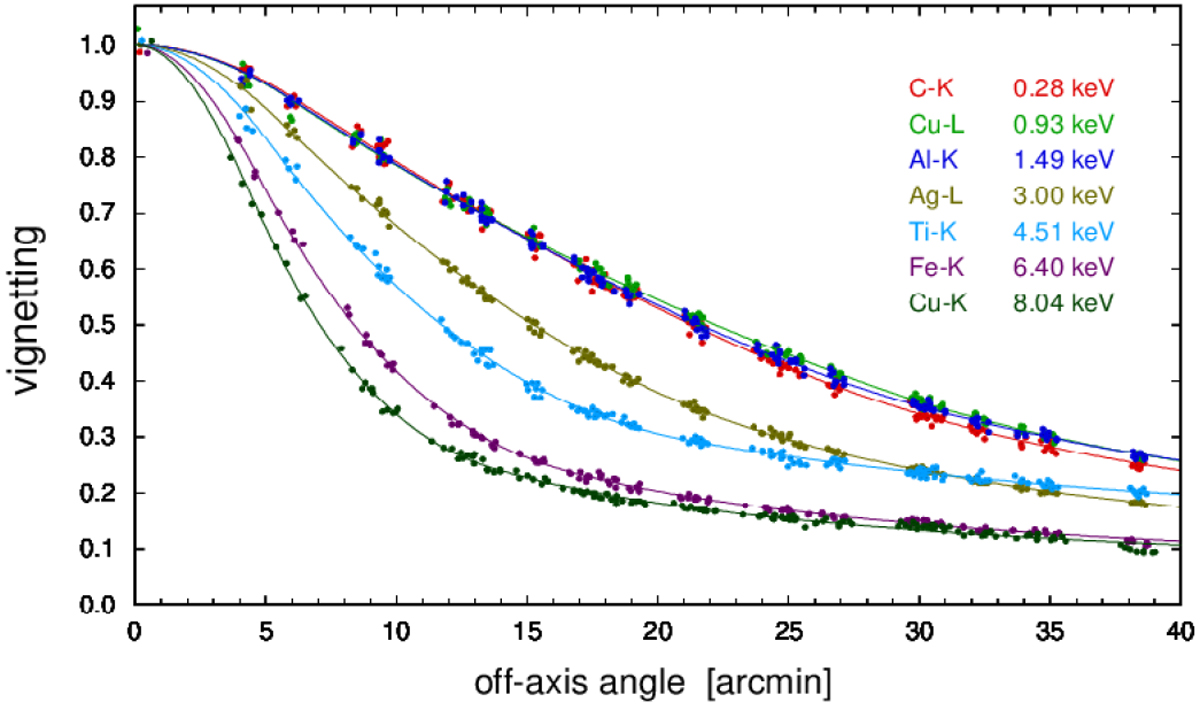
Vignetting curves at seven different energies for TM1. The dots show for point sources the relative encircled flux within r = 4.0 arcmin derived from 1073 PSF images covering the focal plane (see Fig. 7); the curves show the derived parametrized vignetting function. Curves for the other TMs are similar.
Current usage metrics show cumulative count of Article Views (full-text article views including HTML views, PDF and ePub downloads, according to the available data) and Abstracts Views on Vision4Press platform.
Data correspond to usage on the plateform after 2015. The current usage metrics is available 48-96 hours after online publication and is updated daily on week days.
Initial download of the metrics may take a while.